Hyperion
A solar get-you-up-to-speed
The goal here is to get anybody up to speed with the reasoning behind the Solar Industrial Revolution so they can make decisions that make sense in the context of this emerging transformation. Solar has gotten cheap, and the flywheel keeps spinning: big and cheap leads to cheaper leads to bigger. If this continues, the world will be fundamentally transformed. Where and for what processes will cost parity occur first is the critical question.
From Summer 2025, better to publish unfinished than not to at all.
Solar has gotten cheap.
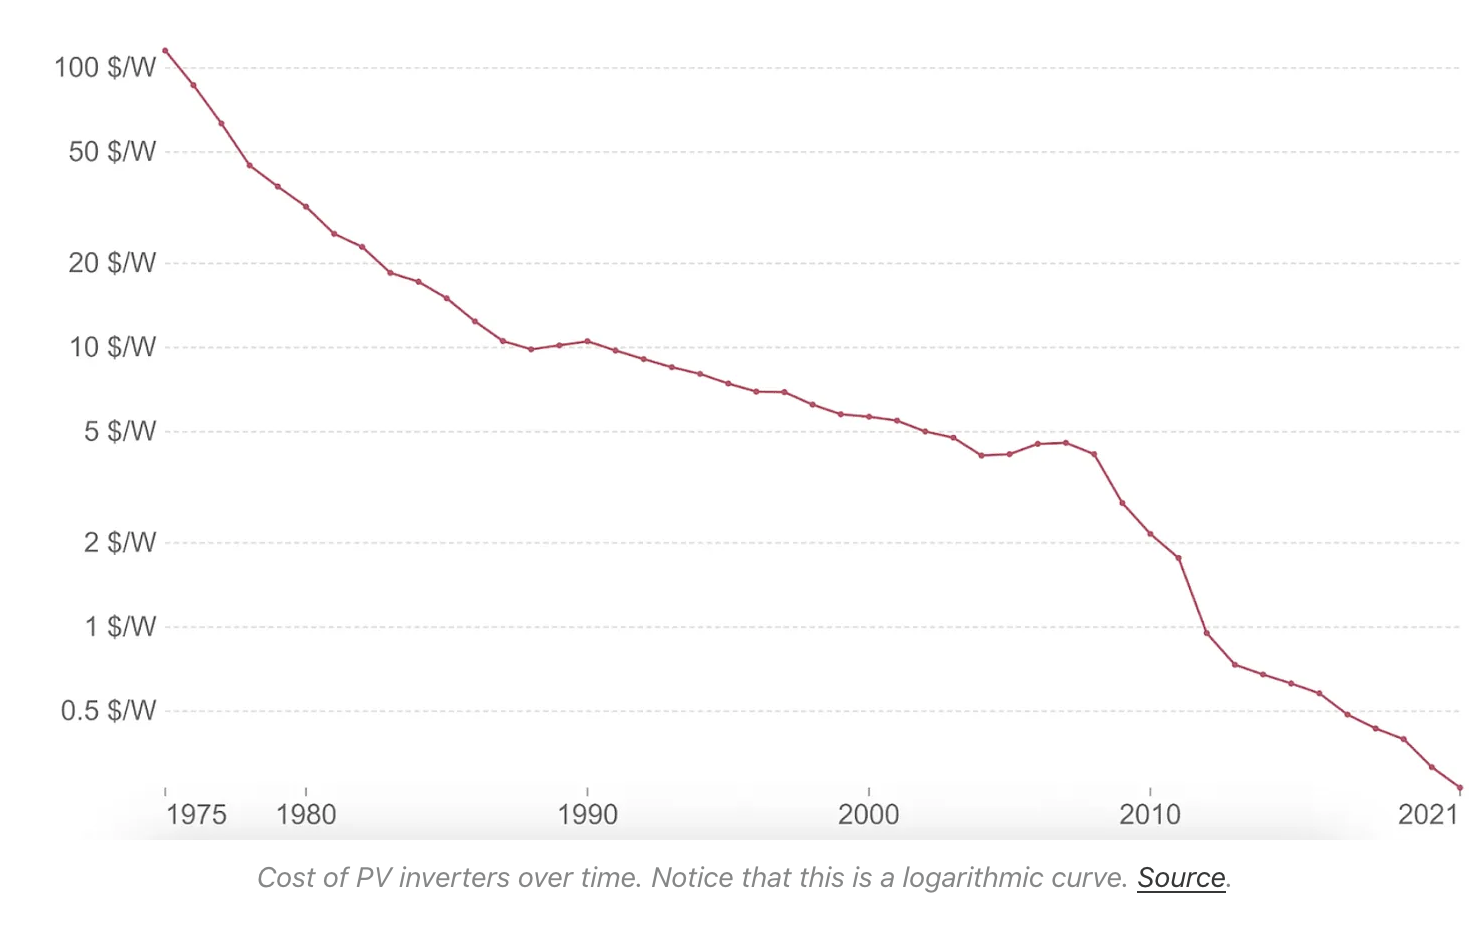
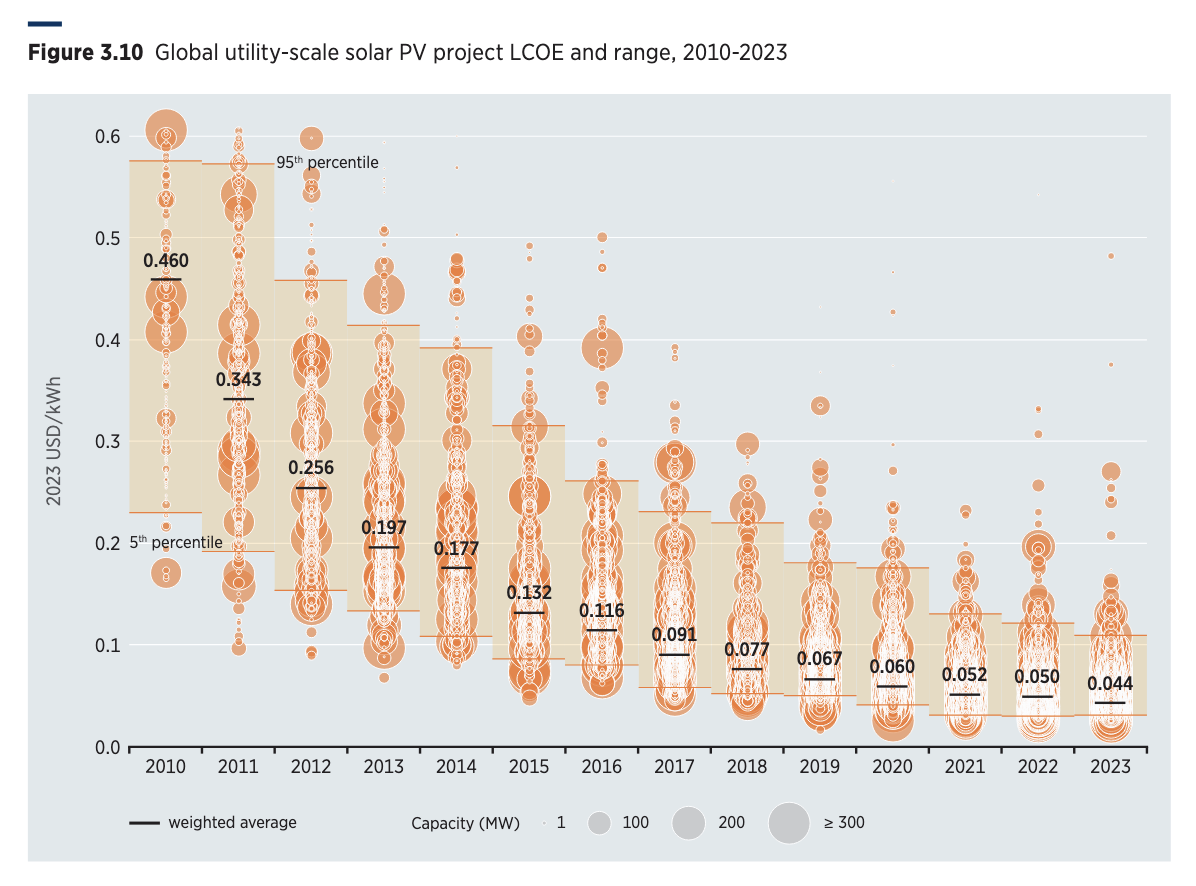
Solar PV energy used to be expensive, a pipedream answer to global warming only possible because of subsidies and research funding. That has changed.
Solar PV energy is now cheap. It is today by far the cheapest scale source of energy in human history.
Solar PV energy will continue to get cheaper for the same reason it has gotten cheap in the past. This will continue for some time.
Why has solar gotten cheap? Chapter 1. The Flywheel.
The deeply intimate relationship between the following two charts creates a feedback loop that will define the next century of industrial civilization.
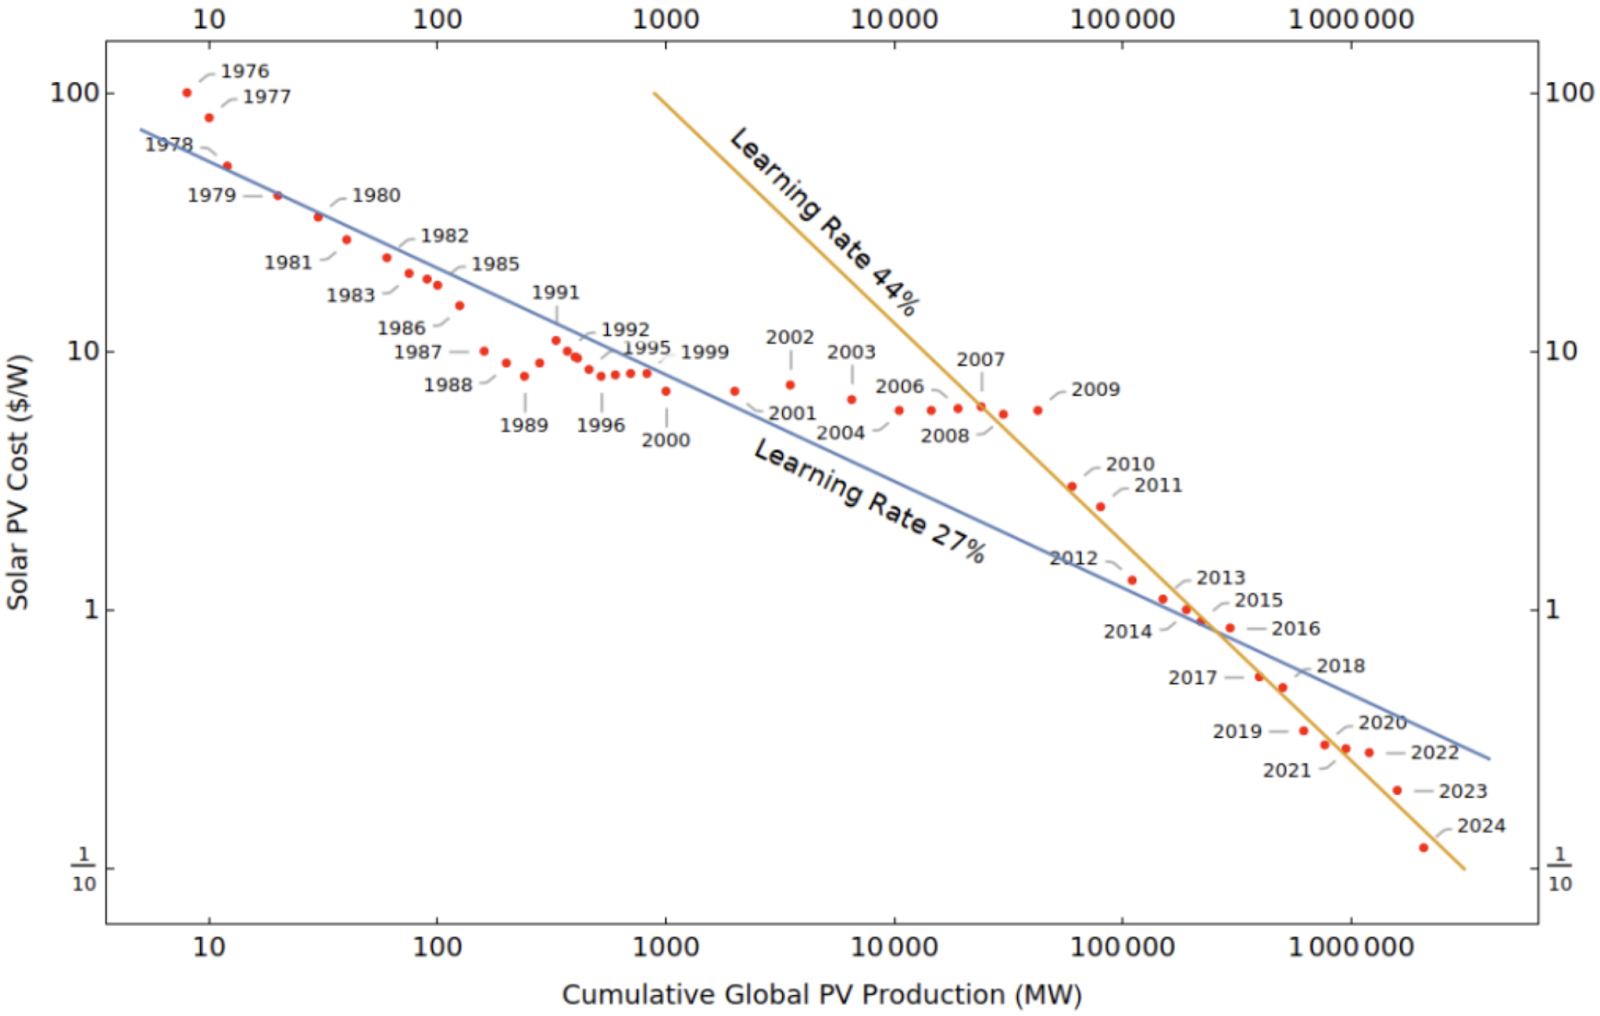
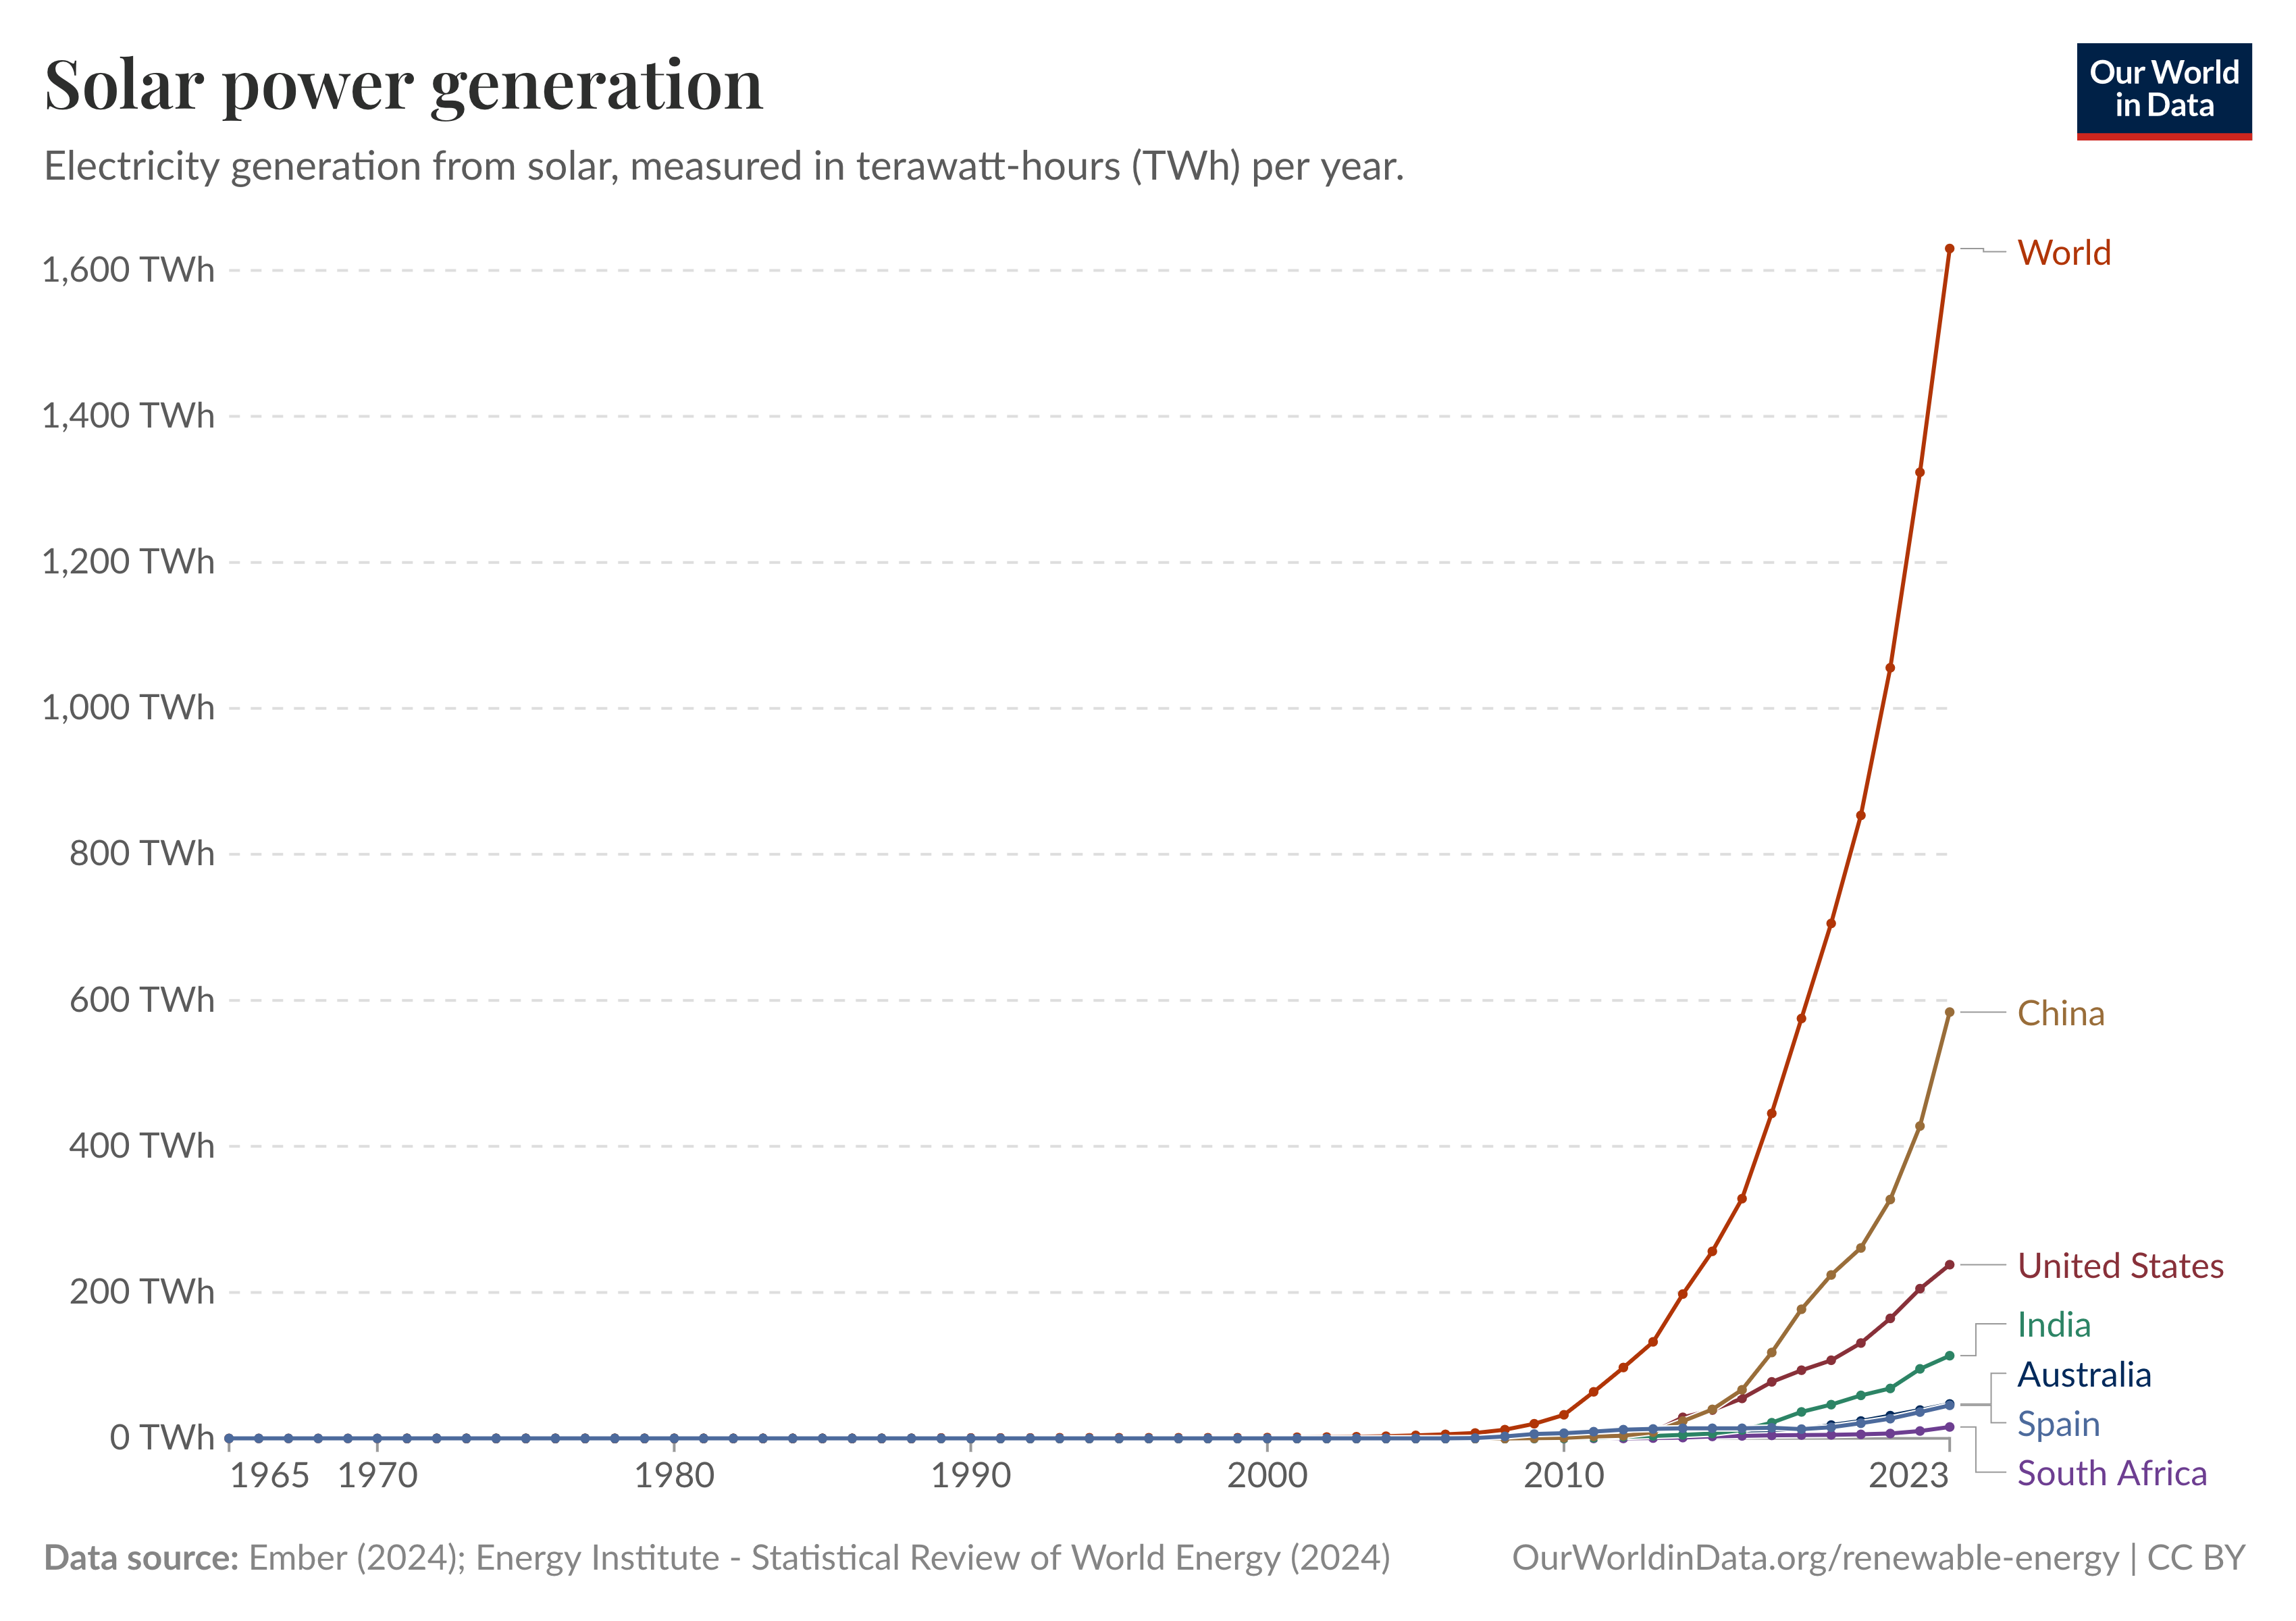
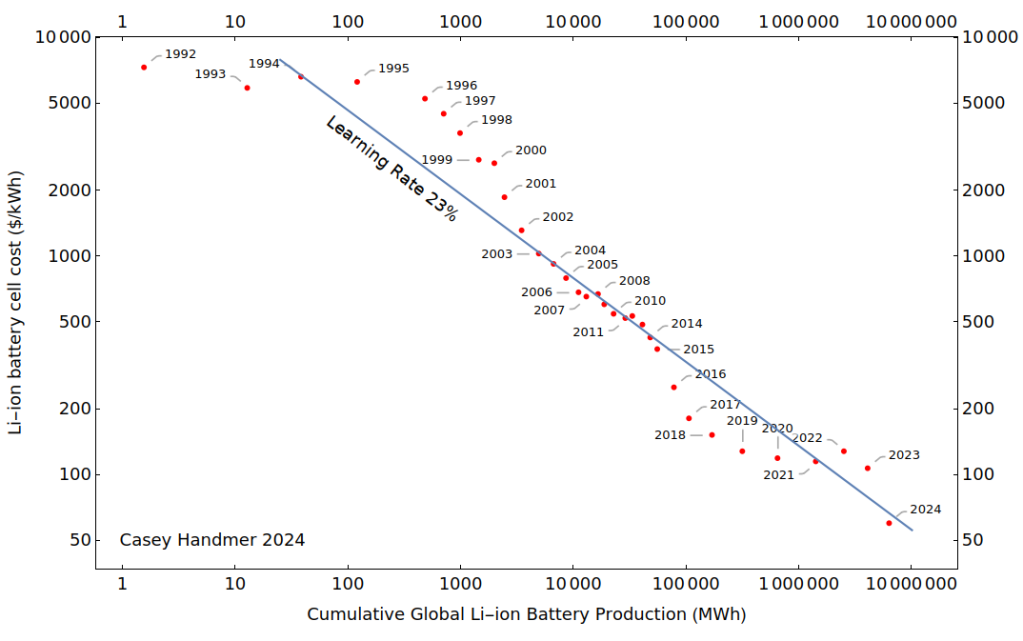
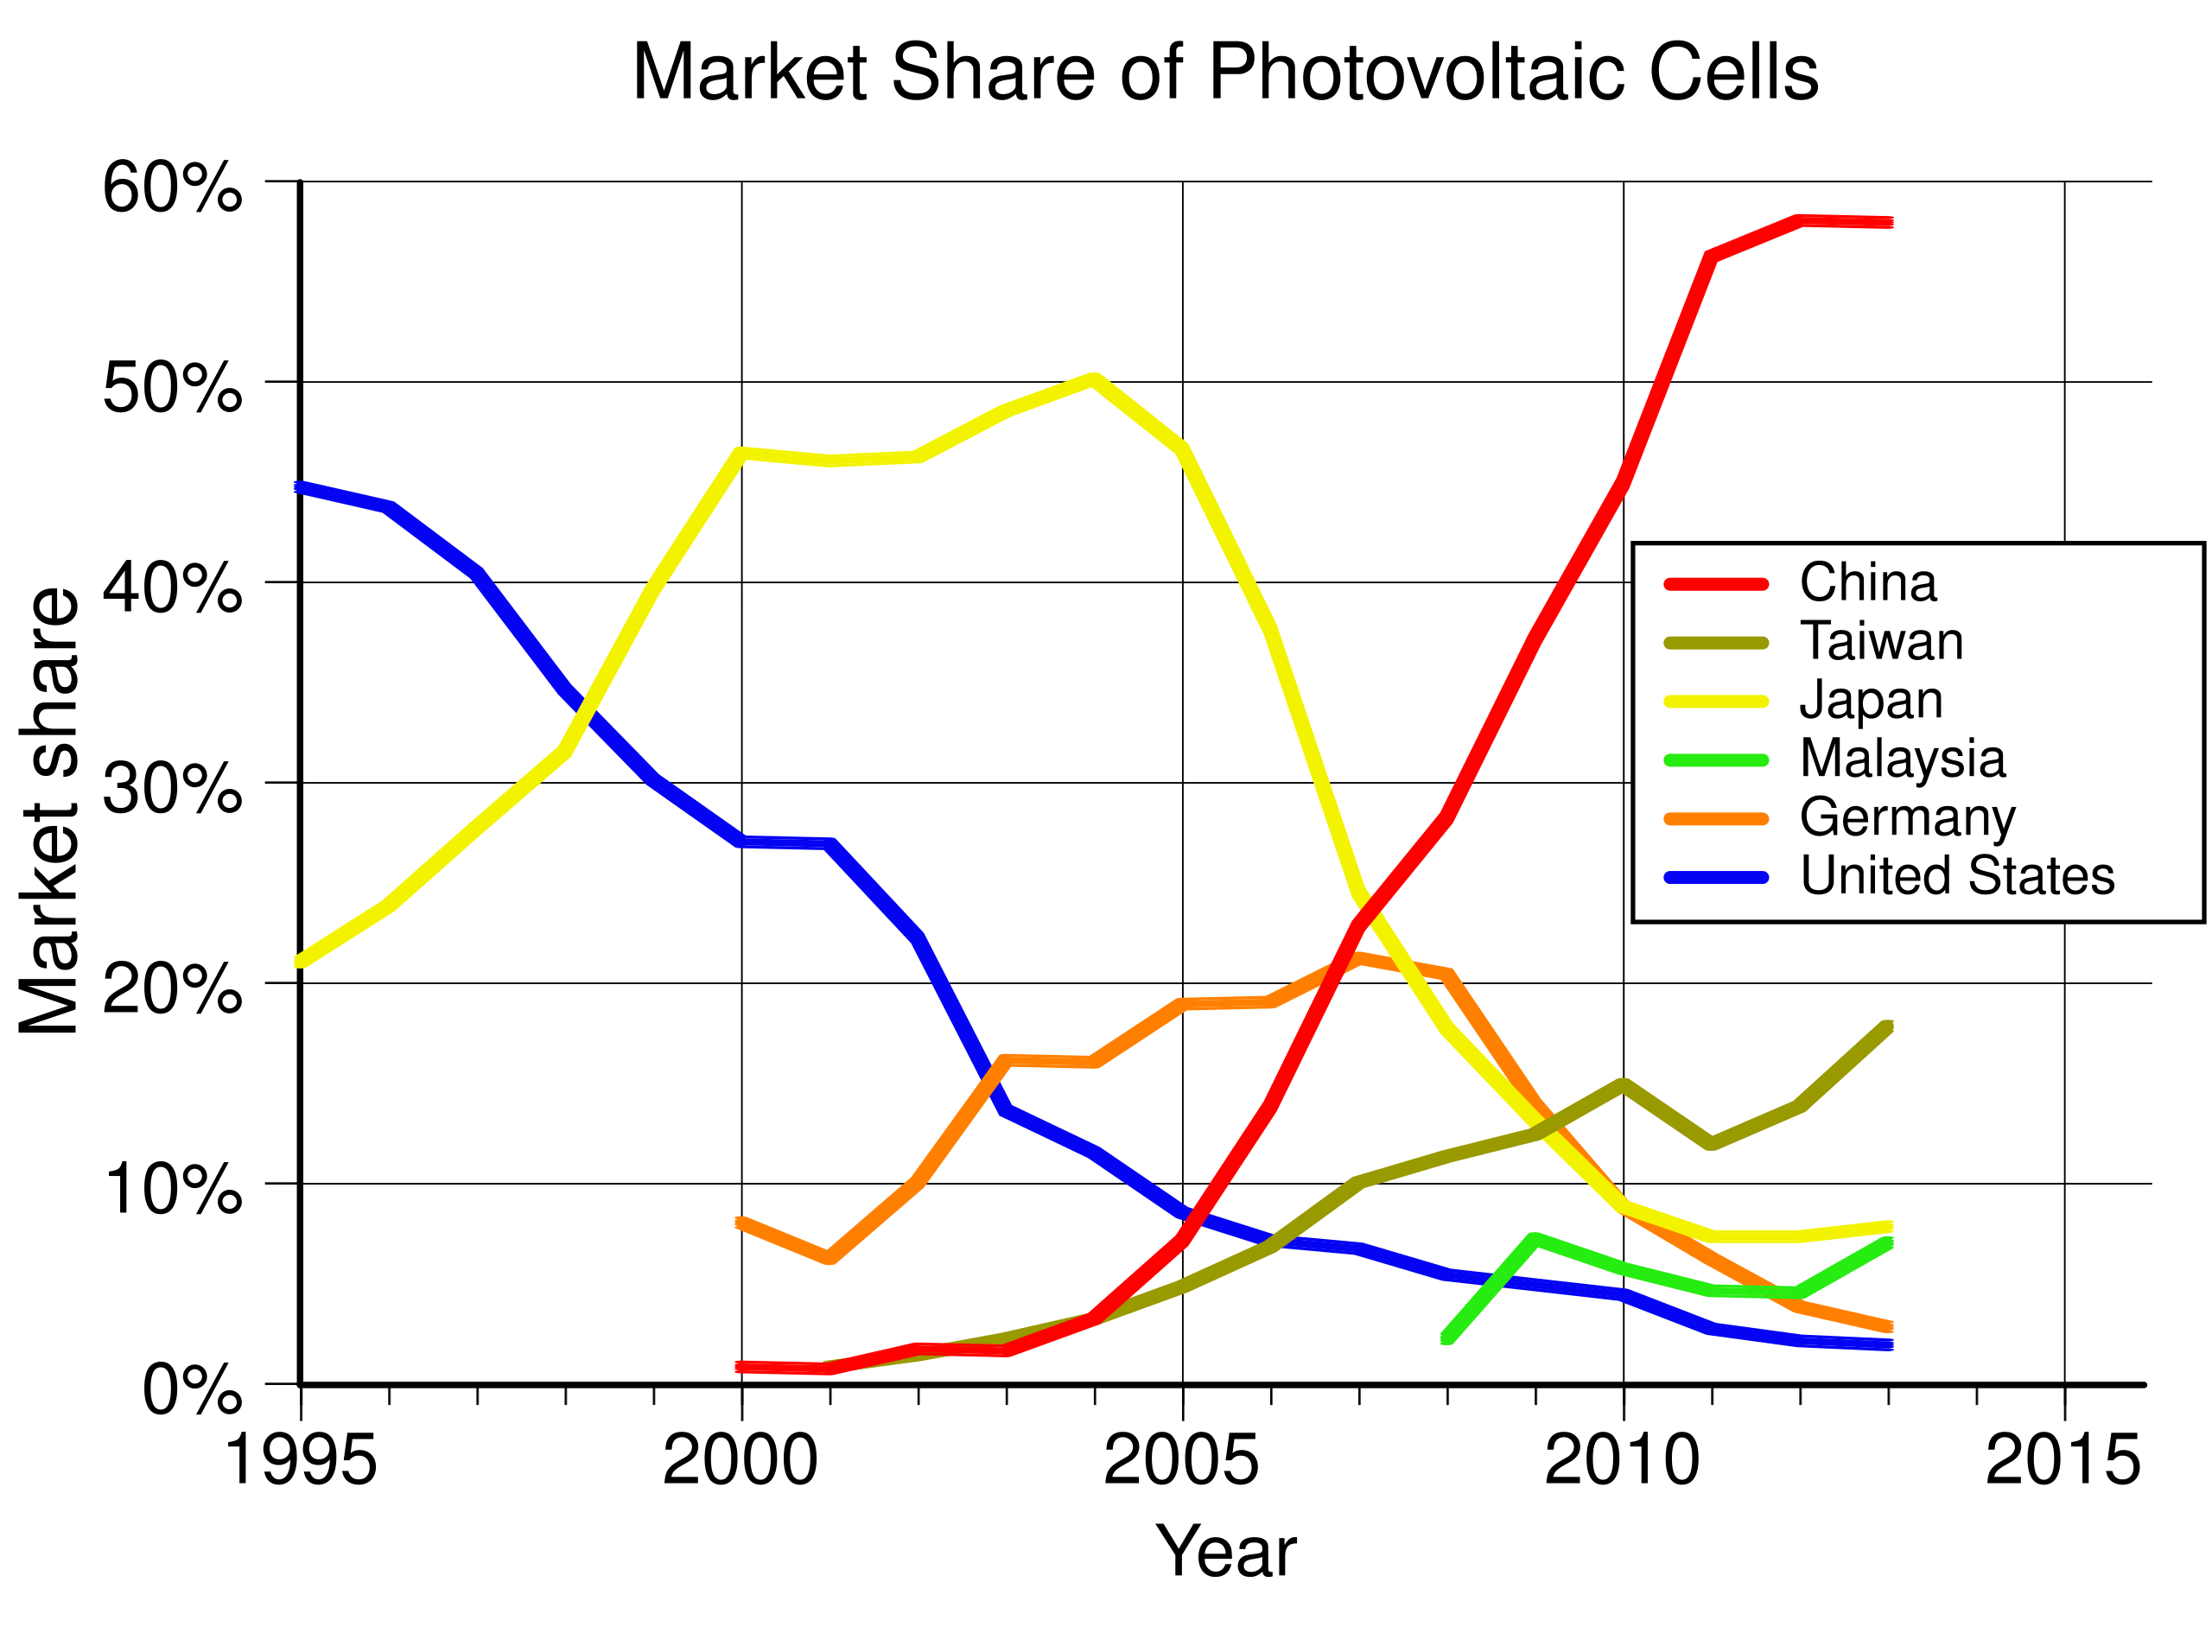
Solar got “cheap, then big, then cheaper, then bigger.”
This is the flywheel that will transform the entirety of humanity’s industrial stack: lower prices of solar energy increases demand for that energy, supply rises to meet demand, experience curves further lower prices as production increases, and the cycle begins anew. This has been in play for roughly 15 years now and has been entirely unsubsidized for about 10 years.
Solar PV energy is already the cheapest scale electricity source in human history. If this cost flywheel continues, solar energy will become very cheap indeed, far cheaper than any of its competitors. No other source that I know of can hope to catch where solar is today, much less solar with a decade or two more compounding.
This is the exact same process (Wright’s Law/experience curves, learning by doing) that has driven Moore’s Law, the defining technological trend of the last half century.
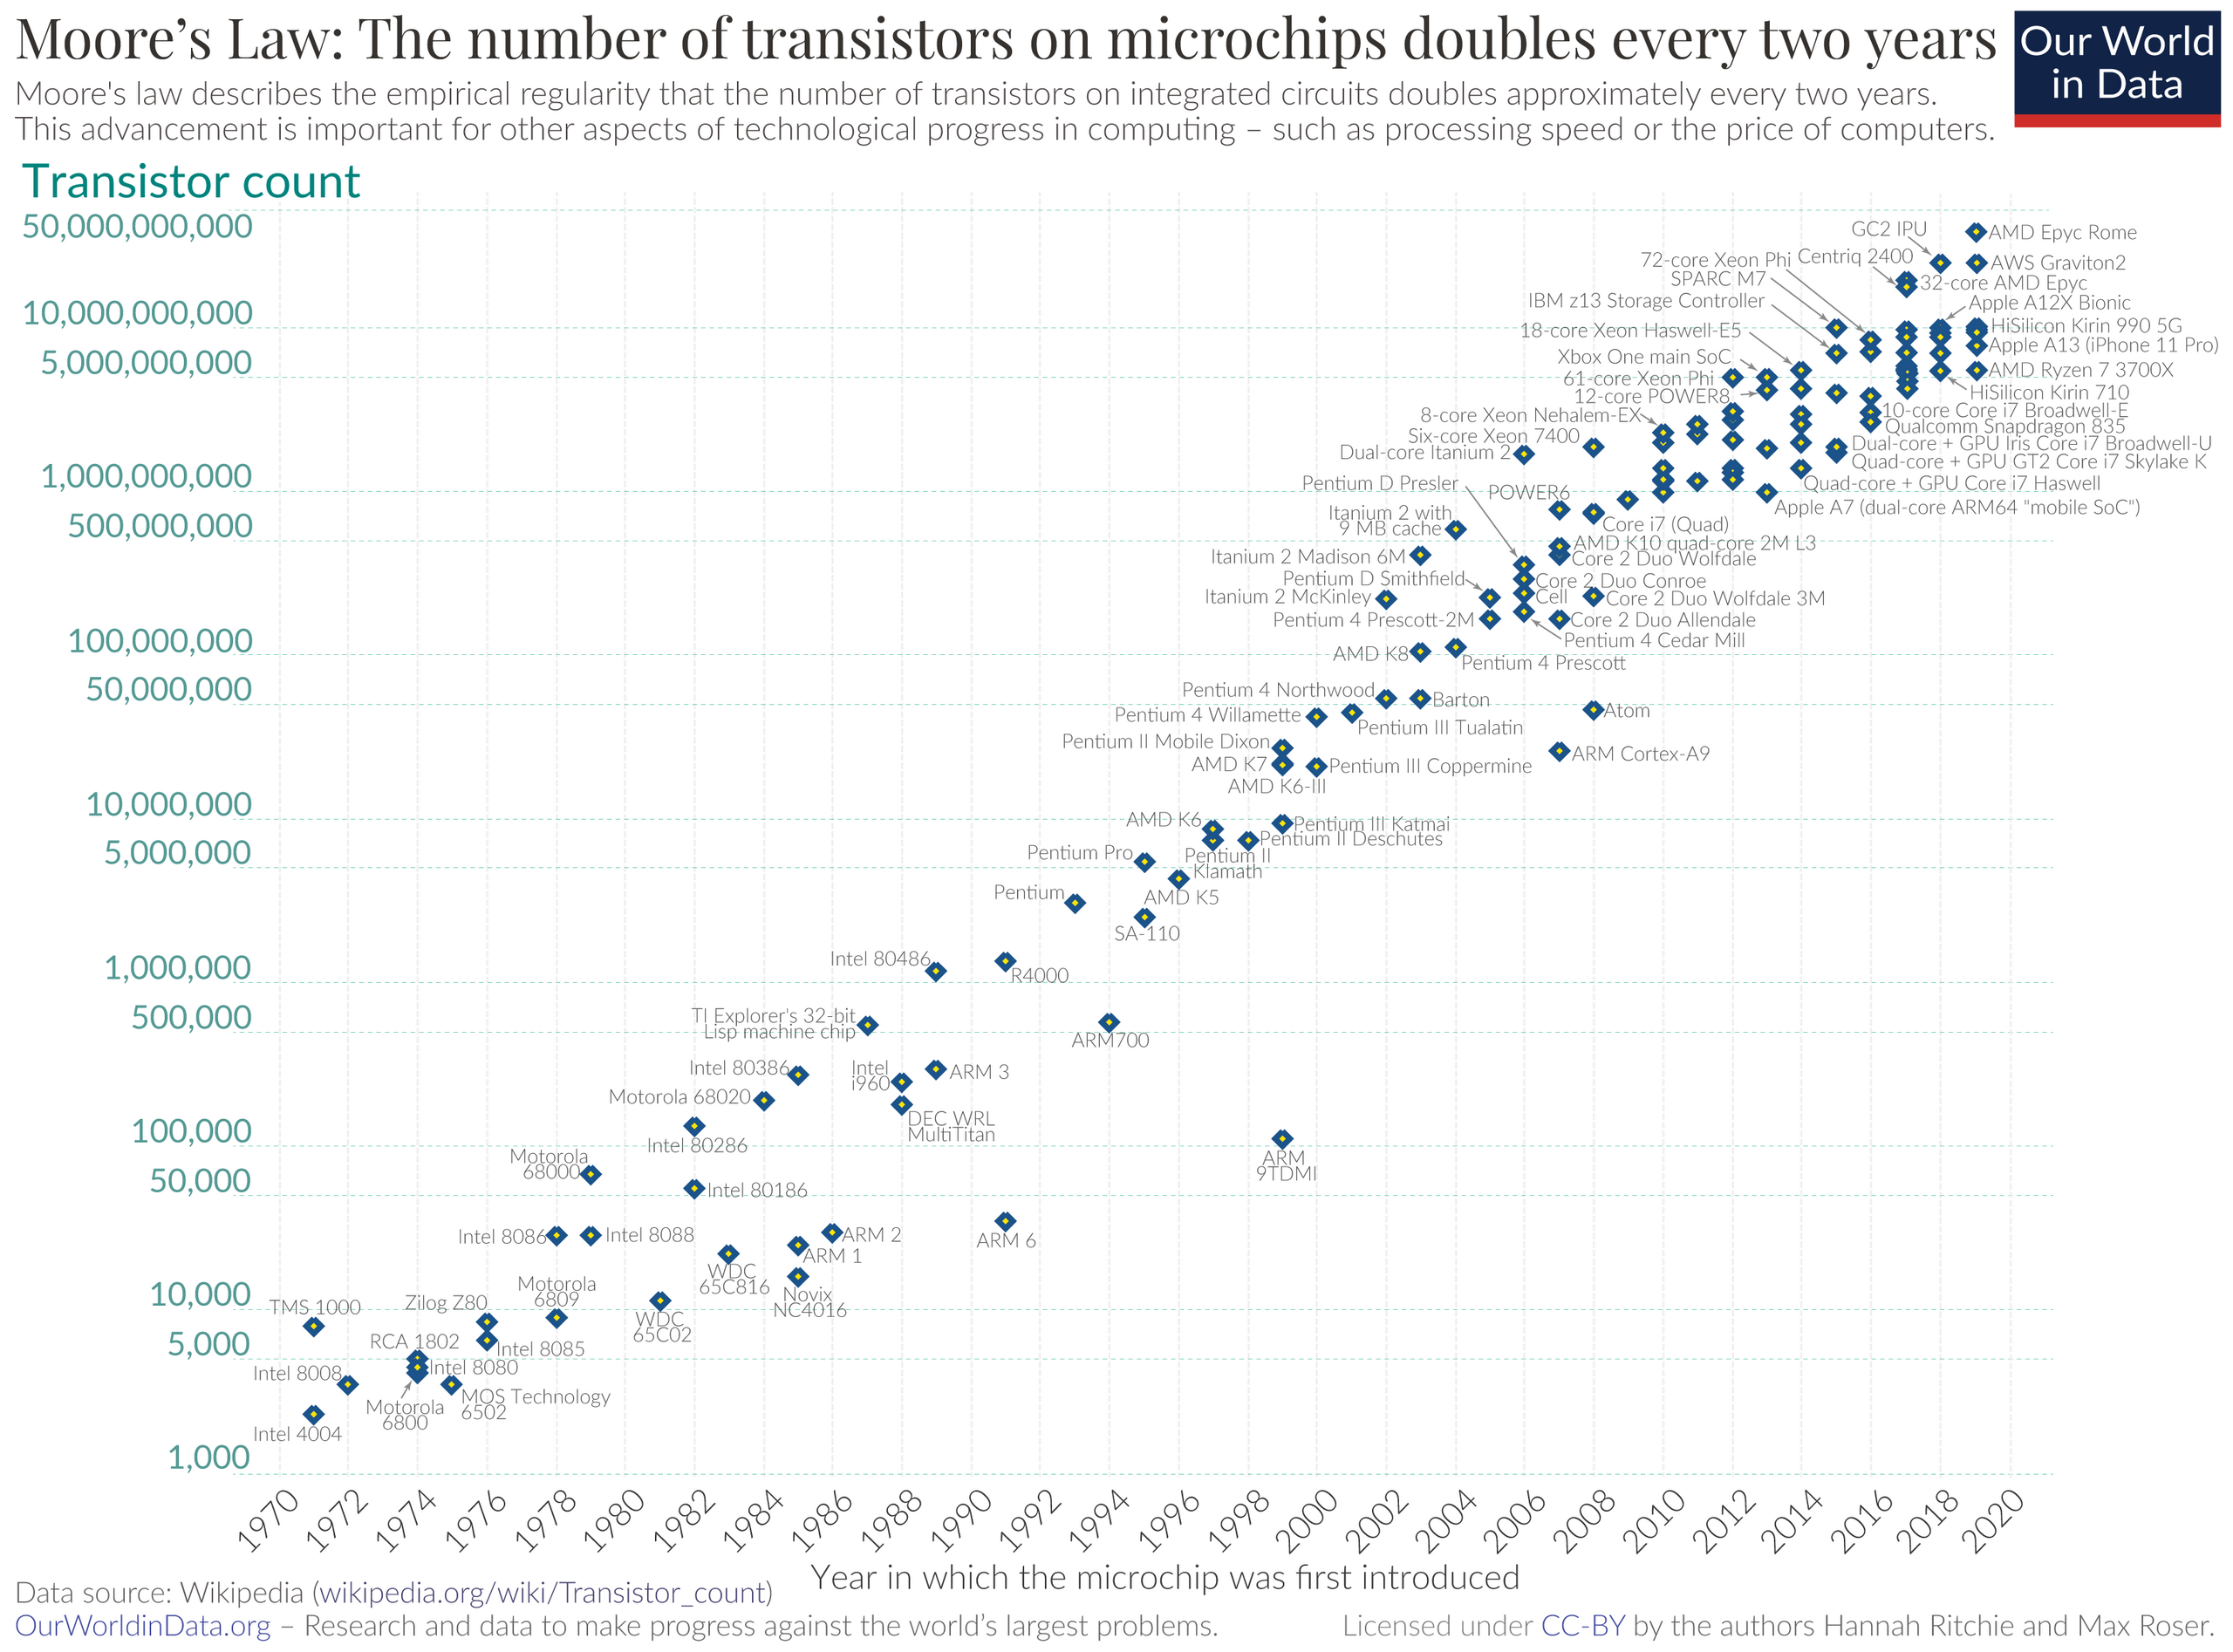
Transistors on a chip is how this is usually stated, but it is better formulated not as a performance metric, but as a general learning curve: $/unit, in this case compute
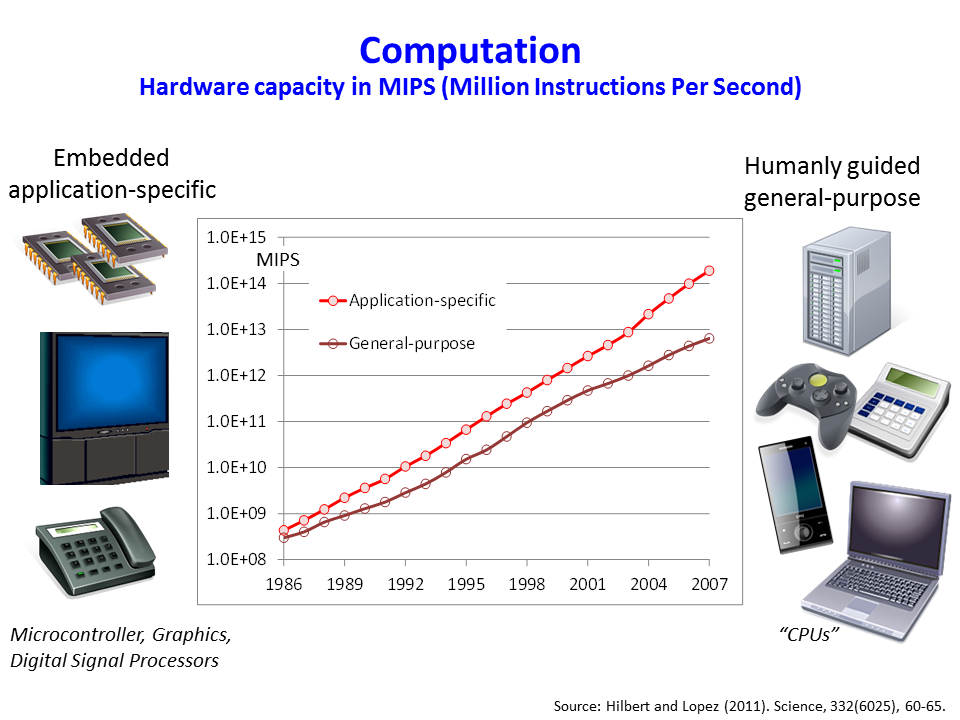
This is weirdly hard data to find. Paper
These phenomena don’t come around often, and are worth paying extreme attention to when they do. Moore’s Law is arguably the only major technological change since 1973 and has completely reshaped the world around it. Probably 90% of the technological change between the world today and the world 50 years ago is downstream of Moore’s Law. It’s not unreasonable to think that 2/3s of all billionaires owe their wealth to Moore’s Law. So long as the price elasticity of demand for the output of an experience curve remains >1, as it is for compute and so far has been for solar energy, there is considerable evidence that learning curves will continue until crashing up against the limits of physics. Moore’s Law is currently hitting those limits today, and is upwards of a million times better than it was in 1973.
The solar version of Moore’s Law is possibly more impactful than the computation version. Energy is not like other commodities. Everything in the universe is either matter or energy. This is a manufacturing process that produces energy as an output. If the solar version of Moore’s Law continues for the coming decades, energy will be at least 10x, maybe 100x, cheaper than it ever has been in human history. The end state of solar’s decosting is far more positive compared with Moore’s Law. We can pull new continents from the oceans, send mass to orbit for pennies on the dollar, travel between a rolodex of vacation homes around the world in supersonic personal planes, sort and reuse trash by atomic weight, desalinate new rivers and turn the deserts into Eden, modify every city on earth to have the idyllic climate of California. There are few technical problems that cannot be solved by dumping more energy at the it. If the current trend of energy consumption and gdp per capita holds, US gdp per capita would be something like 350k per year in a 10x scenario. A 100x would put it around 1.5m per year. Manmade wonders beyond our comprehension will be in reach, all our sci-fi dreams fulfilled. This is the solution to the Great Stagnation, the reversal of WTF1971/1973.
What might stop this from continuing? I don’t want to bet my life trajectory on the “21st Century’s Moore’s Law” that comes to an abrupt end in a few years.
To get cheap, solar has to get big. To get big, solar has to get cheap. The flywheel grinds to a halt if either of these stops being true. So let’s look at what might stop solar from getting bigger or cheaper.
What might stop it from getting cheap? (supply side)
Broadly, the cost of solar energy is dependent on the input cost of a solar panel and the cost of the rest of the solar array. Here, we’ll focus only on the manufacturing side that yields a commodity called a solar module. That the commodity called a solar module continues to decost during the upcoming decades is the all-important assumption in this essay which must be defended. This is where the difficult feats of electrical and manufacturing engineering are being done. There are huge additional costs (and opportunities) on the installation side, but they are comparatively simple problems to solve.
The cost of any piece of physical capital (eg a solar panel or a machine that makes solar panels) is the sum of the opex of materials, energy, and labor used to create it and the amortized capex of the capital used to produce it (the cost of which is recursively its own opex and capex).
To lower the costs of a solar panel, its materials, embodied energy, embodied labor, and amortized capital of its production system must all stay low and get lower. The learning curve of the past two decades has pushed each of these factors down lower every year, using fewer expensive materials, less energy, less labor, and using production systems with more substantial scale economies. For costs to continue falling, each of the 4 factors must not rise or hit a plateau.
Scarce materials would drive up prices. In the limit of the experience curve, the cost of a solar panel is equivalent to its material cost. High material costs would put a floor on the learning curve. This isn’t a problem for solar PV however.
You can make a solar panel with just 7 elements: Silicon (semiconductor, glass), Boron and Phosphorus, (semiconductor dopants), Aluminum (conductor, structural), Oxygen (glass, polymers), and Carbon and Hydrogen (polymers for waterproofing etc). Si is 28% of the Earth’s crust, Aluminum is 8%, Oxygen is 47%. Hydrogen is the most common element in the ocean. Carbon is the 4th most common element in the atmosphere and 4th in the solar system as a whole. I’ll make the assumption that these are so wildly common that material scarcity will not be a problem for at least a century, probably longer. B and P are rarer, B is 0.001% of the earth’s crust and P is 0.1%. While essential, their use in semiconductors is negligible, between 4 to 9 orders of magnitude more silicon is used than these in a solar cell. The semiconductor industry today uses between less than 1/10000th of the world’s production of these elements; most goes to glass, detergents, and fertilizer. We could up solar PV production 1000x without world production even noticing.
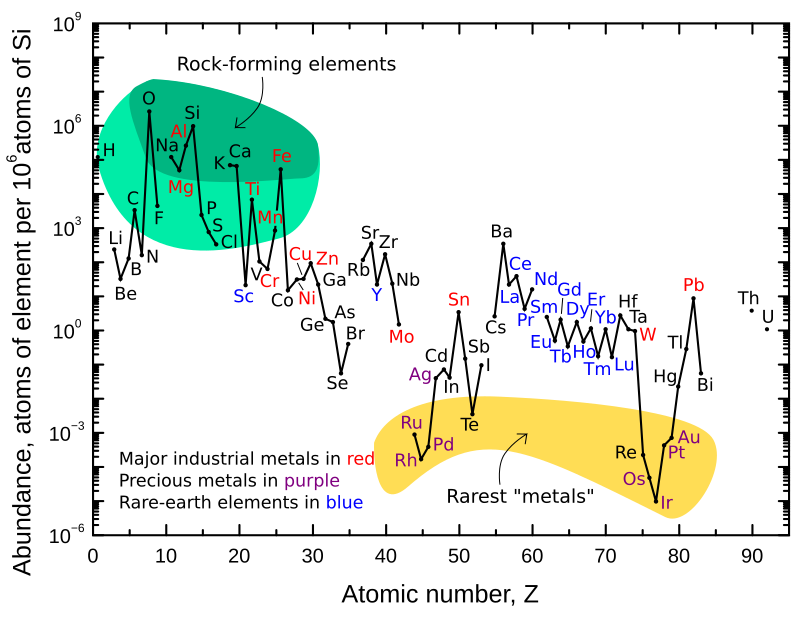
More scarce elements like copper and silver can and are being substituted. Right now, making these substitutions reduces the panel efficiency by a few percent, but this is an acceptable sacrifice to keep costs low as solar production scales up the OOMs.
Scarce energy would drive up prices. In reality, the opposite will happen. Cheap solar power will deflate its own cost, making the high embodied energy of something like purified silicon become an ever smaller component of the cost.
Labor cost is already negligible. Solar module production is already almost completely automated, but impending AGI promises to finish the process, sending labor cost to 0. There are significant labor costs on the installation side, but that’s out of scope for this section.
A manufacturing plateau would prevent prices from falling. This is the most worrisome of the 4. I don’t understand the production process well enough to determine if we could cut the price by 10x or 100x over the next century. It’s possible that we somehow get so good at making these things that we can’t seem to lower the cost further.
I’m skeptical of a plateau in the near future at the very least.
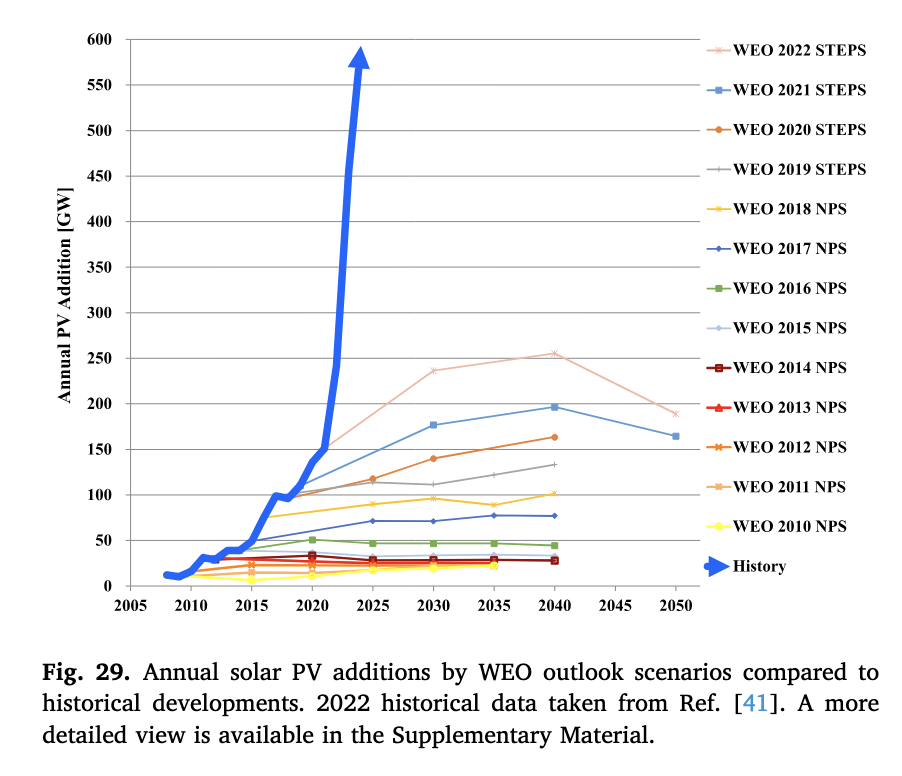
Famously, in what’s called solar’s “hairy back”, every prediction of solar by the IEA or IMF or similar “official” organizations has massively underestimated global deployment growing exponentially and $/W falling exponentially. This is overwhelmingly an underestimation of improvements on the manufacturing side. It seems unlikely that this growth trend will break in the near future at least; when something has happened for 20+ years straight, it will almost never come to a screeching halt soon after.
In the long term, there are more reasons to believe that the improvements continue.
While it’s dangerous to draw straight lines on log plots into the future, Moore’s Law is a notable precedent for a wildly complex manufacturing process that has continued to improve and decost exponentially for half a century, despite many critics’ prophecies of its end. Solar panels and integrated circuits are both similar semiconductor production processes with ICs being by far the more difficult of the two to produce
Practically, what might 30 more years of Moore’s Law - like progress look like for solar?
Let’s consider the simplest a solar array can be in the limit and what production process could produce it.
“What is the Platonic ideal of a solar array? An array needs a 50 um thick layer of silicon to be fully opaque, and perhaps 100 um of necessarily flexible plastic “backing” material to provide mechanical support.” Radical Energy Abundance
This solar array will be made of the 7 elements mentioned above. We’ll stop thinking of solar arrays as collections of solar “panels” and more as solar “sheeting”.
This is generally called thin film solar, and these arrays have been made successfully. However, it is important to note that they are not currently the cheapest form of solar and the chinese solar industry’s pursuit of silicon wafer PV modules is what has led to solar’s miracle cost declines and the near total obliteration of the thin film industry. Only a single company remains, First Solar, producing modules at roughly double the cost of the leading Chinese companies. This is a significant gap, but within the ballpark of wafer-based production systems when you consider the immense scale advantage the Chinese industry has over First Solar alone.
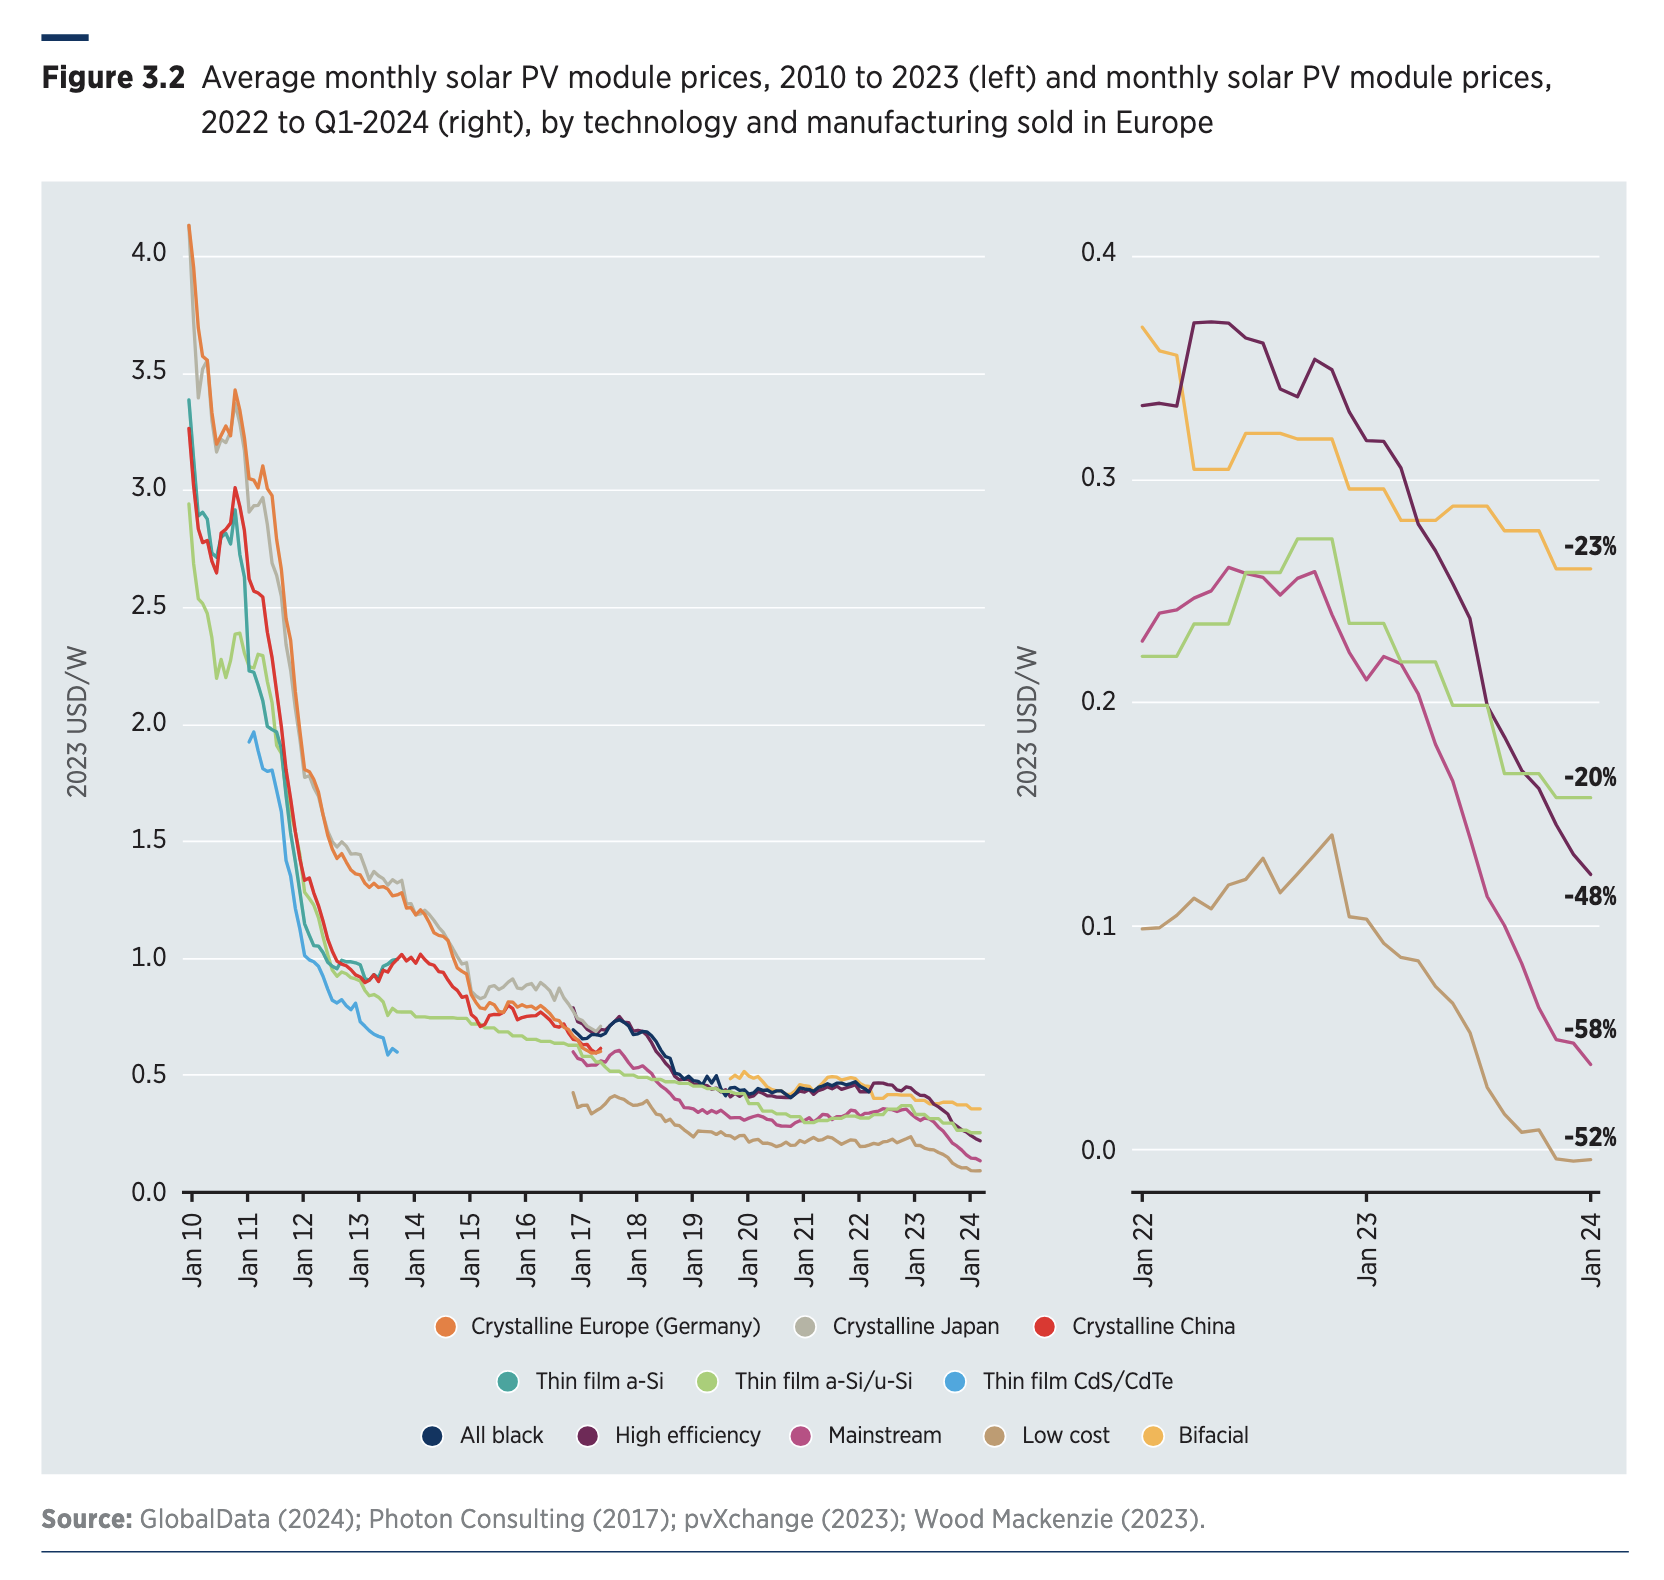
Broadly thin film has dropped in line with crystalline
In the limit we’ll be able to print solar arrays like we print newspapers and use roll to roll manufacturing to bring costs extremely low.
https://www.youtube.com/watch?v=G7zYpvtRAlE
Today, newspaper is around 2 to 3 orders of magnitude cheaper than solar modules per sq ft. I’ll consider that an ugly lower limit estimate for how cheap a printed thing made from common materials can be. Solar might get even cheaper than paper, which is made from complex molecules that have to be grown and harvested on a ~10 year cycle and are sucked from the air using biological machines that convert solar energy to useful energy at roughly 1000x lower efficiency than a solar array. There’s also no embodied information premium with the print design changing daily.
What might stop it from getting big? (demand side)
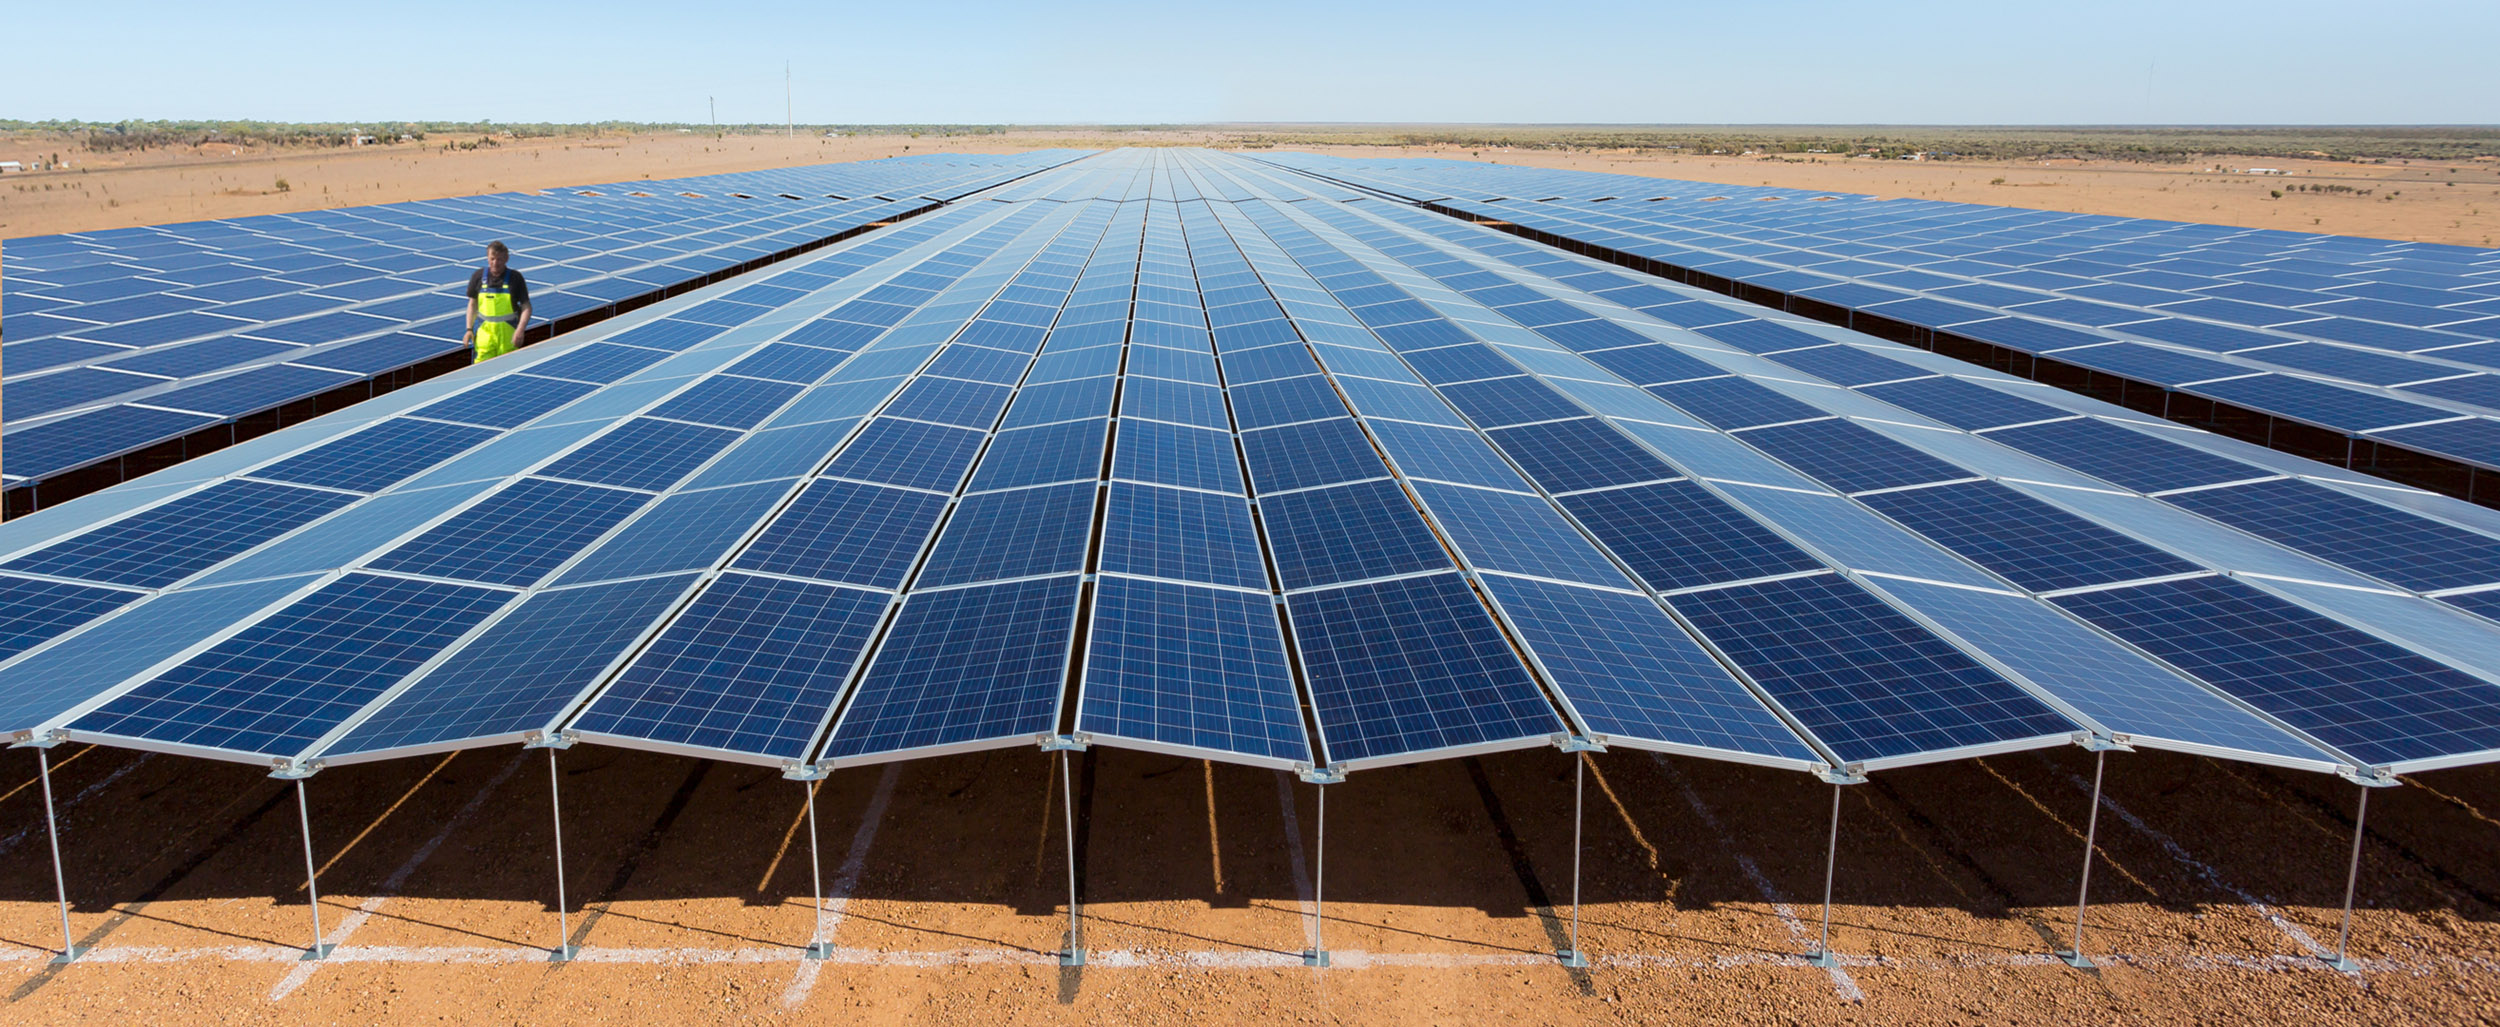
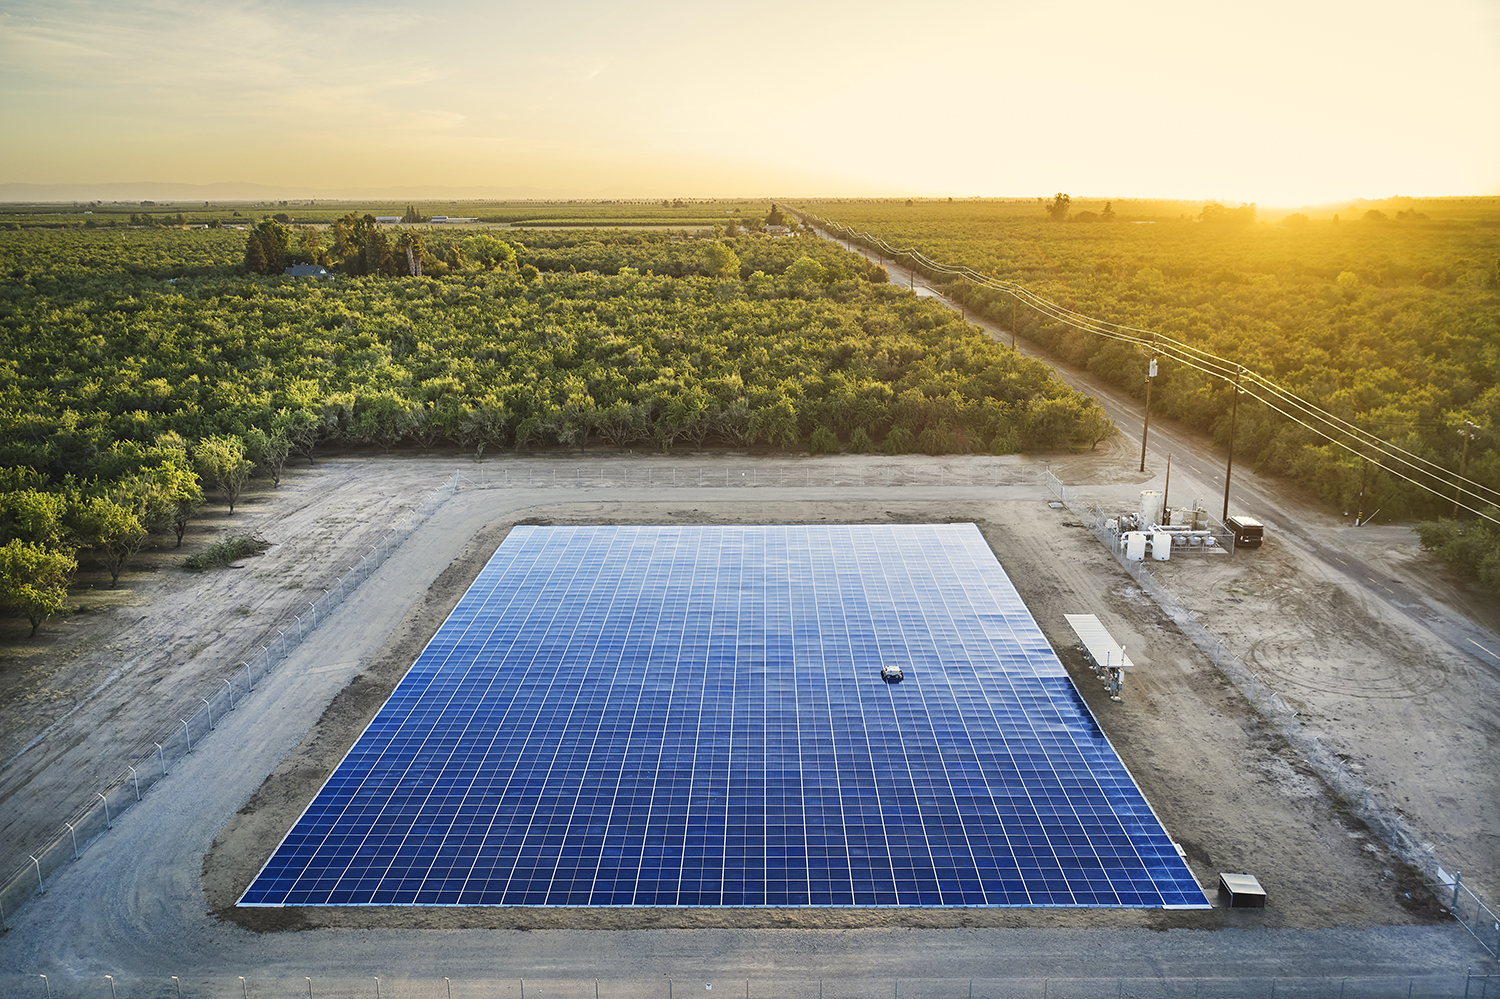
Too little space:
Solar energy is a reversal of our energy sources’ increasing power density that has been play since the beginning of the industrial revolution. It uses noticeably more land to generate a unit energy than fossil fuels or nuclear. Obviously, higher power density is better, but it isn’t obvious to me why solar having lower power density is a showstopper; $/W and $/Wh are the most important metrics. The additional value of the land they take up relative to other energy sources is baked into that price, and that amount is negligible.
Many people worry about the massive land use of solar arrays, but most of the complaints are about how starkly they stand out against the landscape as opposed to the absolute actual land use. Farmland and cattle grazing land take up far more land than solar does, even if we 10x our energy consumption.
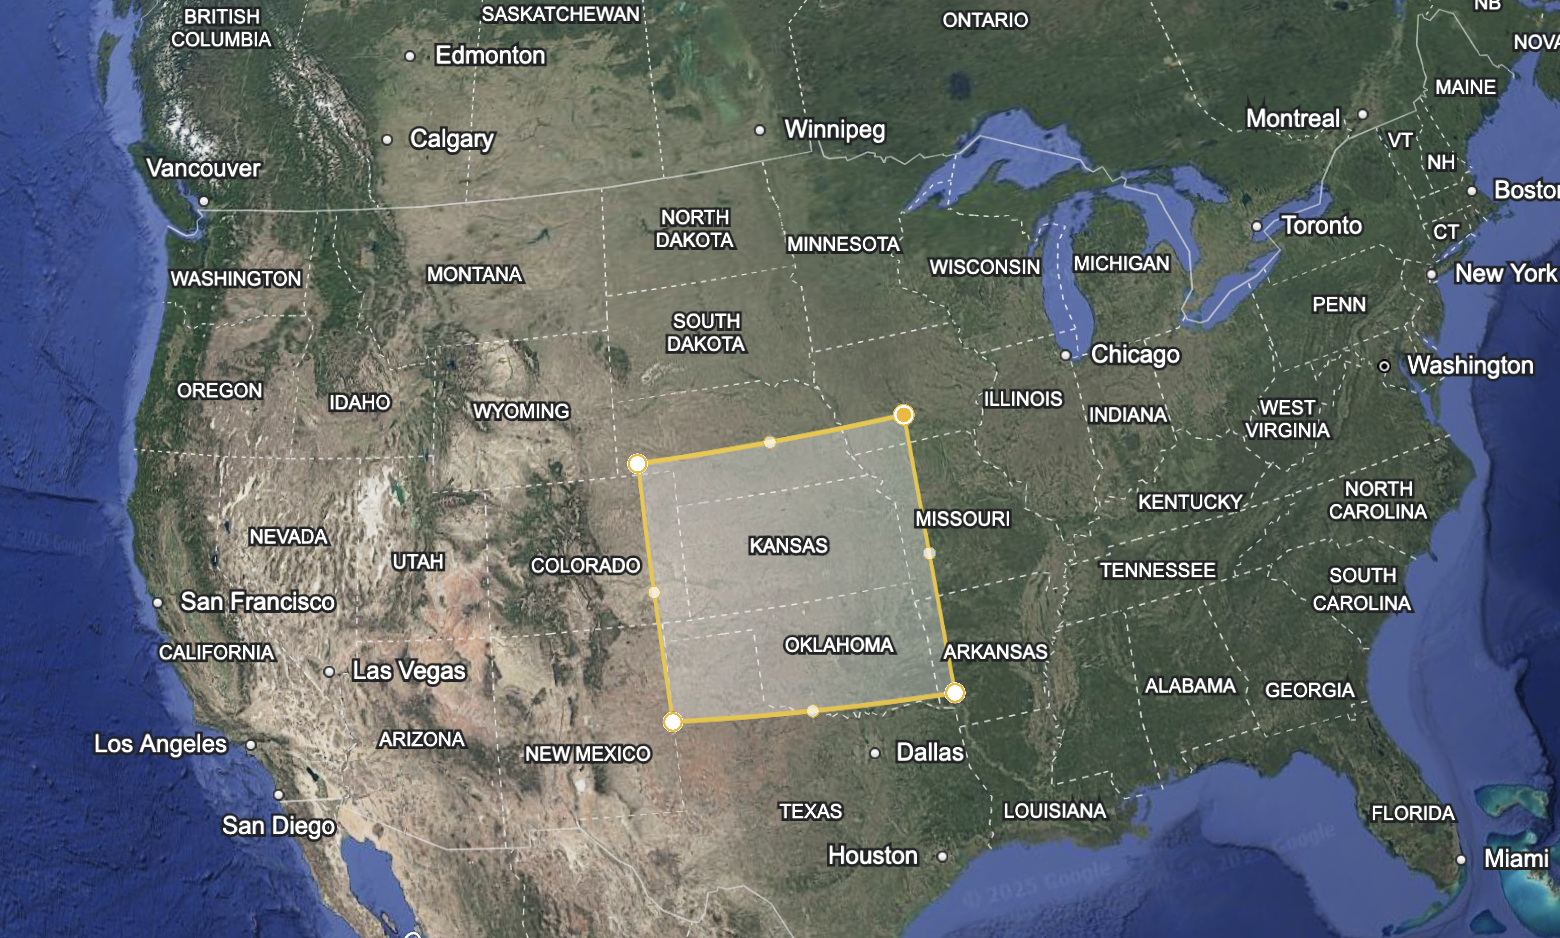
Powering the US with pure solar (all primary energy, not just electricity) would use about 55% of the land we currently devote to ethanol production alone. It would be an area about the size of West Virginia: 65k sq km, or 0.66% of the US’s land area. This is not much land.
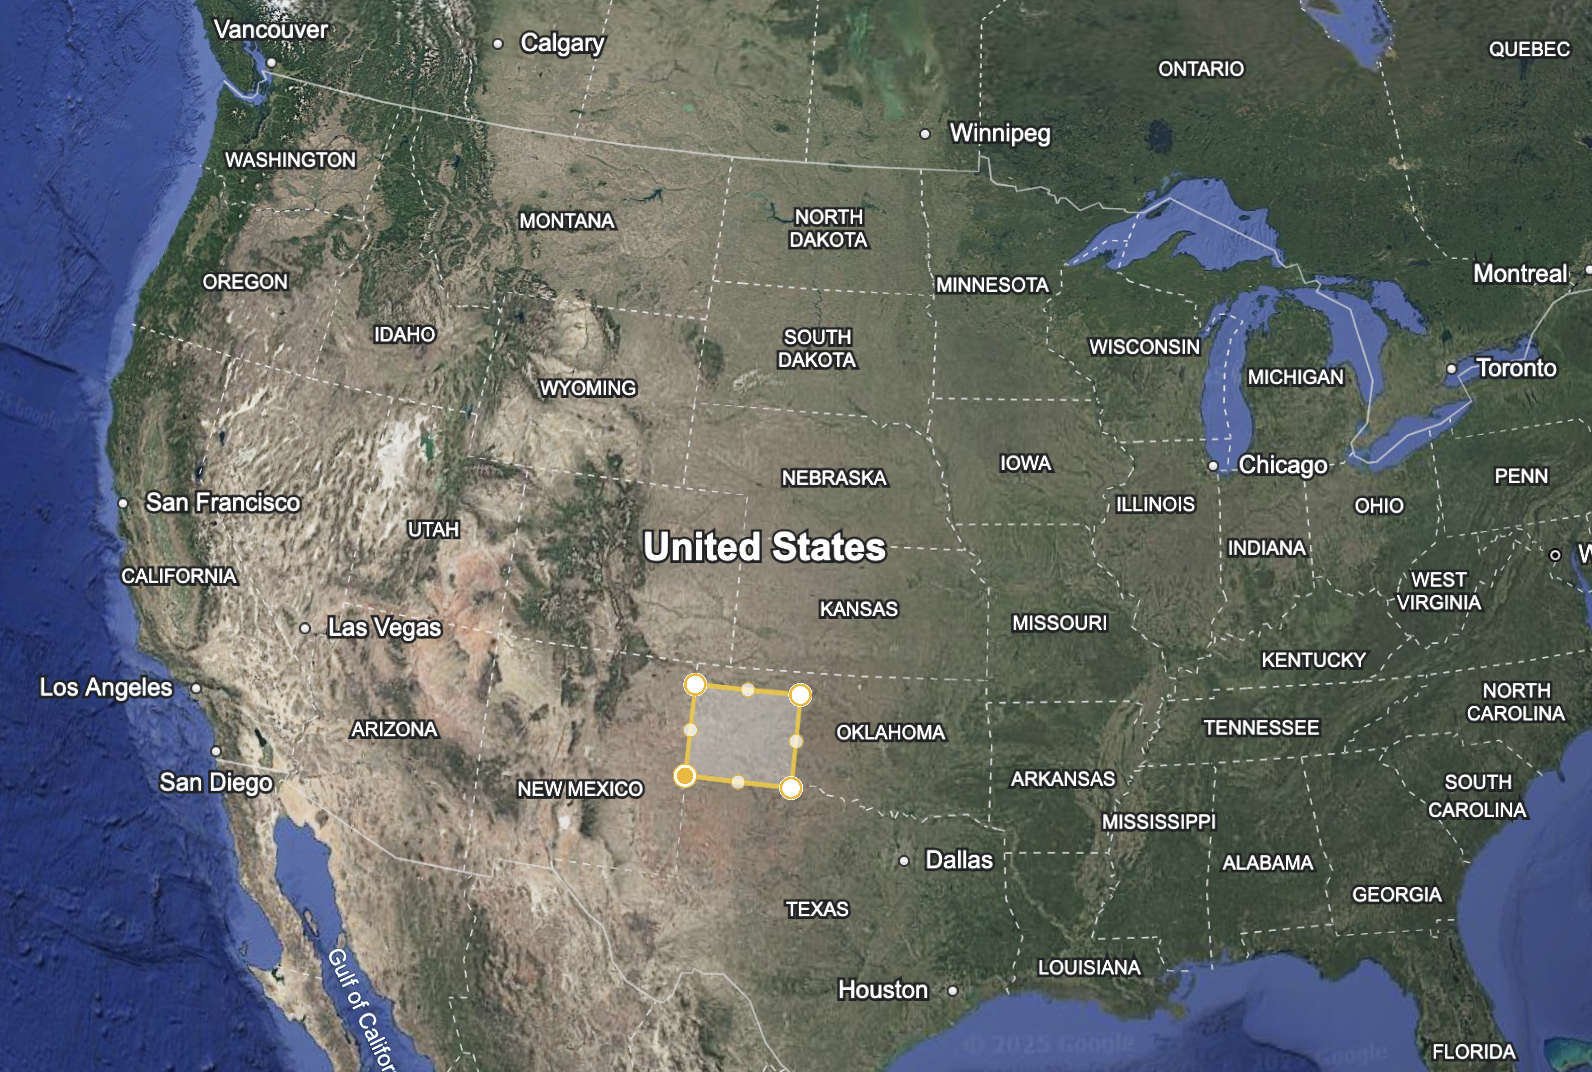
65k km^2. 0.66% US Land Area. 1x US Primary Energy.
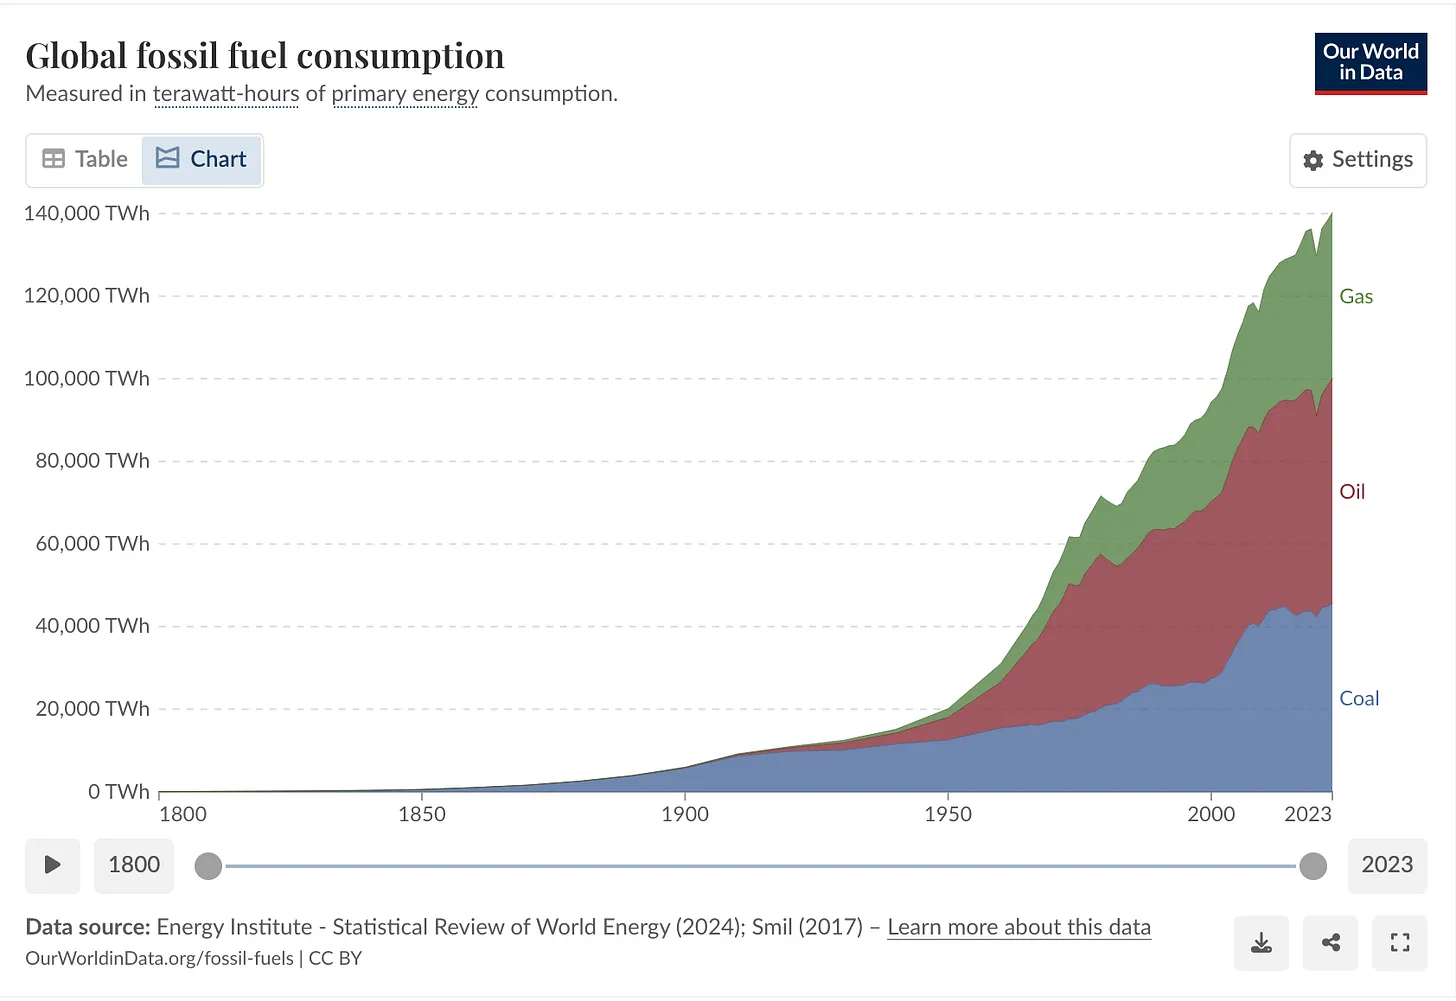
But the solar industrial revolution will hardly be successful if we only transition our current energy system to solar. Far more interesting, and more likely, is a classic energy transition similar to that seen first with coal, then oil and gas. In classic energy transitions, a new energy source exponential is layered on top of a mostly plateaued previous energy mix.
A similar thing will most likely happen with solar.
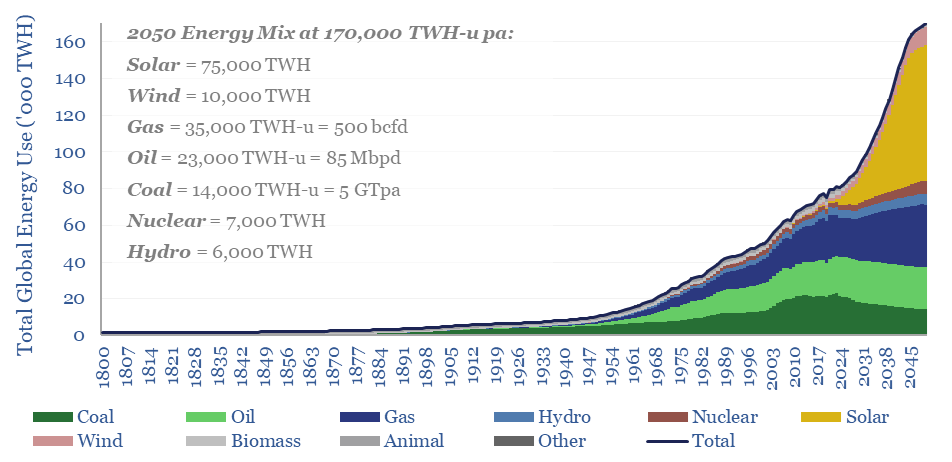
The difference of course, is that solar is a self-deflating energy source. Every other energy source in history has gotten more expensive on the margin, solar gets cheaper on the margin. This is wildly different than any energy source we’ve used before. Instead of the 2x humanity’s energy consumption that Thunder Said’s scenario predicts, something closer to a 10x, or even a 100x, is possible if bottlenecks don’t show up.
What do these 10x and 100x scenarios look like? Are they even possible from a land use perspective?
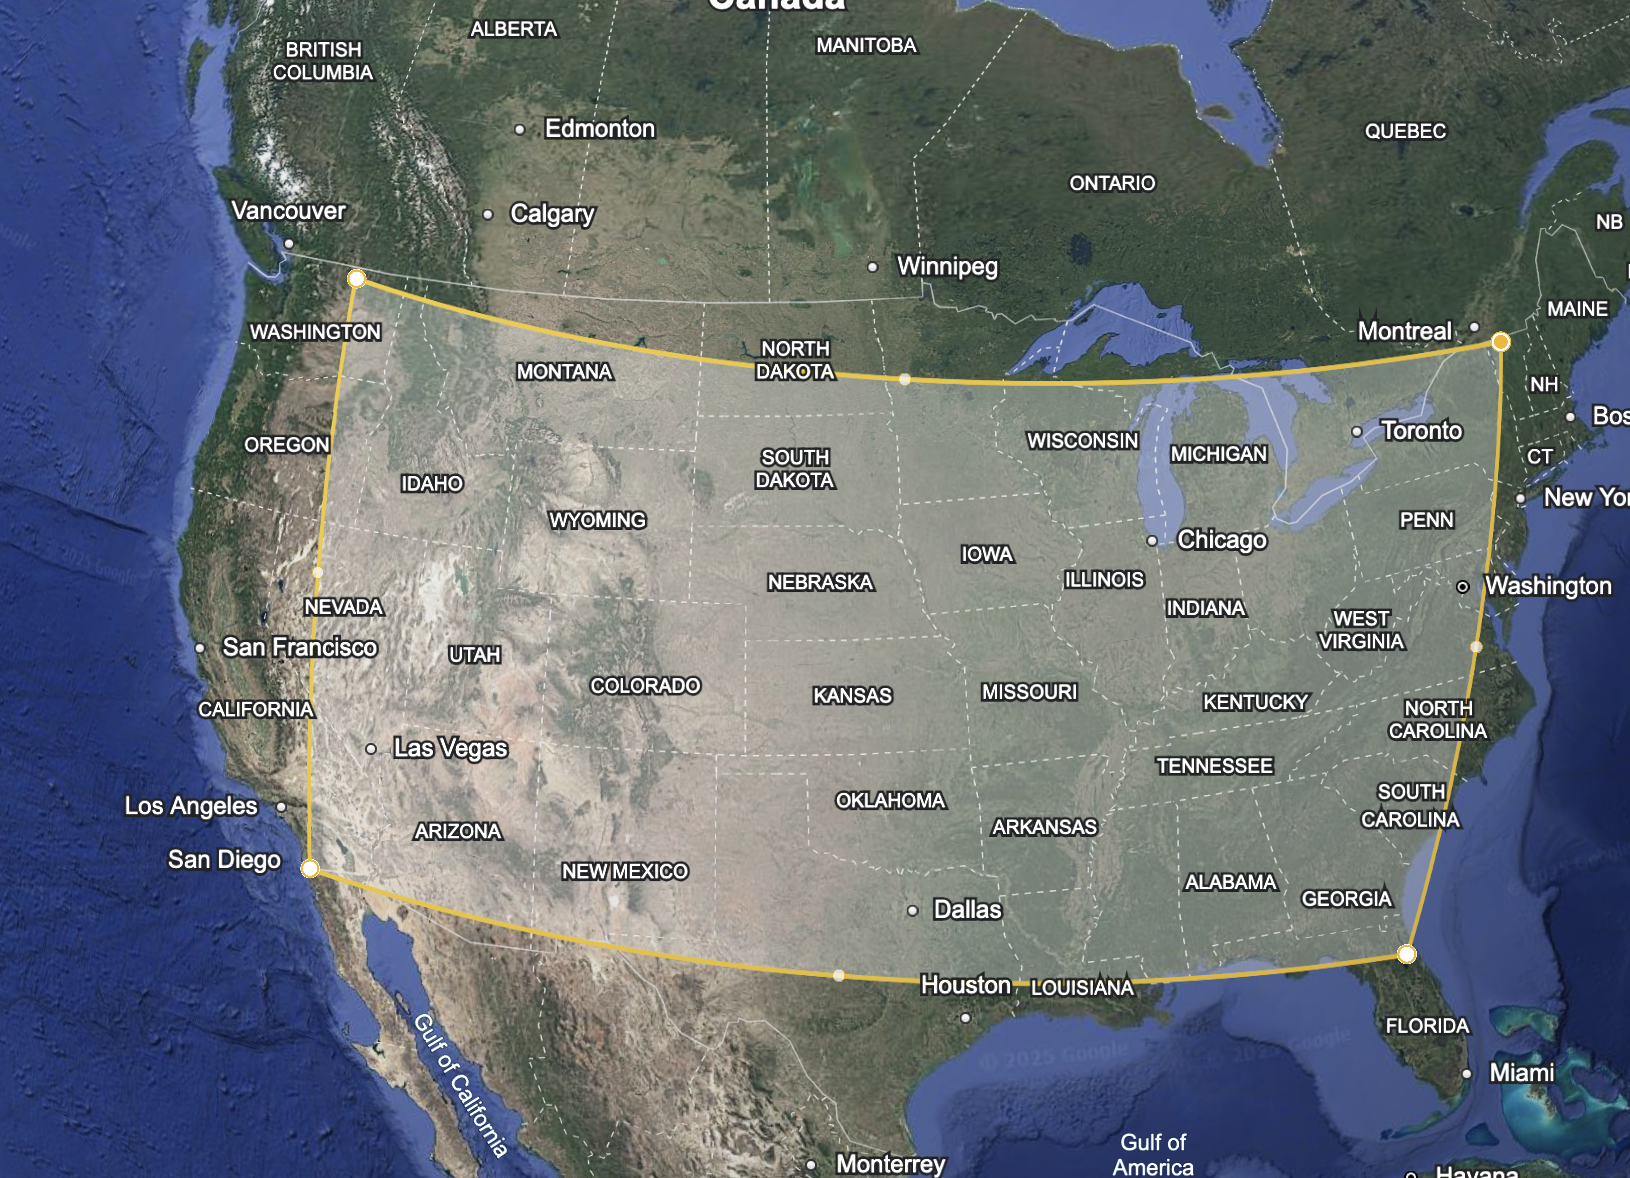
650k km^2. 6.6% US Land Area. 10x Primary Energy
This is a lot of land. It will of course be spread across the country, not in a single block in the middle. But this is a significant land use choice.

In comparison, 6.6% is still far less land than the ~35% that is used for cattle grazing in the US. Would I replace 20% of our cattle grazing land with enough solar arrays to 10x our energy consumption per capita? Yes, absolutely, this is a great tradeoff. This is the difference between the average Indian and the average American in terms of energy use. This is a greater difference than that between the average American in colonial times and the average American today. A 10x increase in energy consumption would produce a thoroughly sci fi looking society.
6.5m km^2. 66% US Land Area. 100x Primary Energy
100x seems obviously impossible to me on land, but putting solar arrays on the ocean could be a real solution.
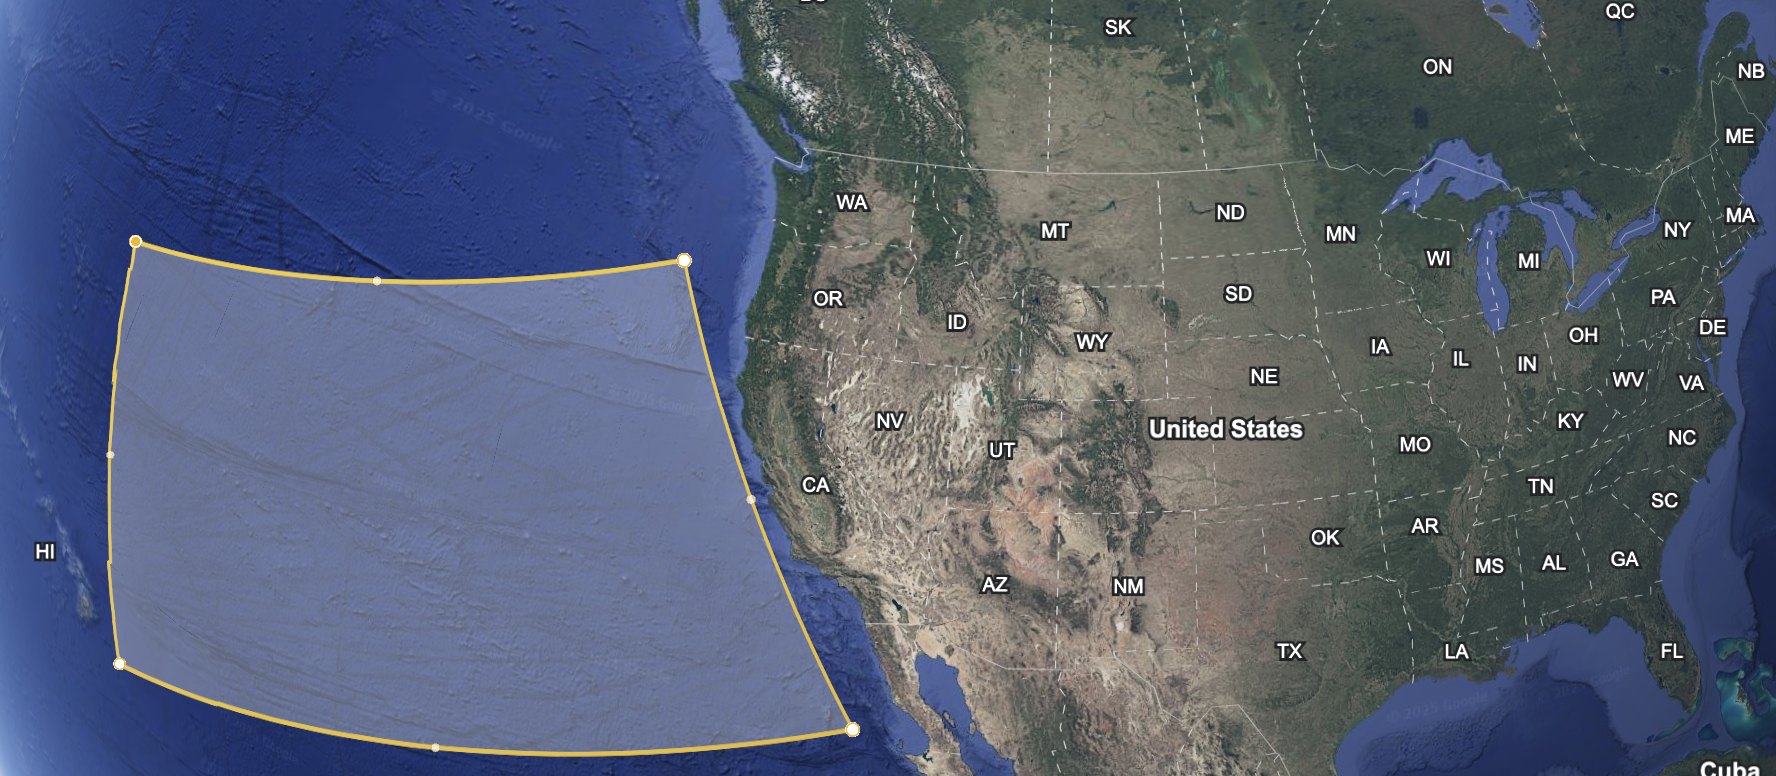
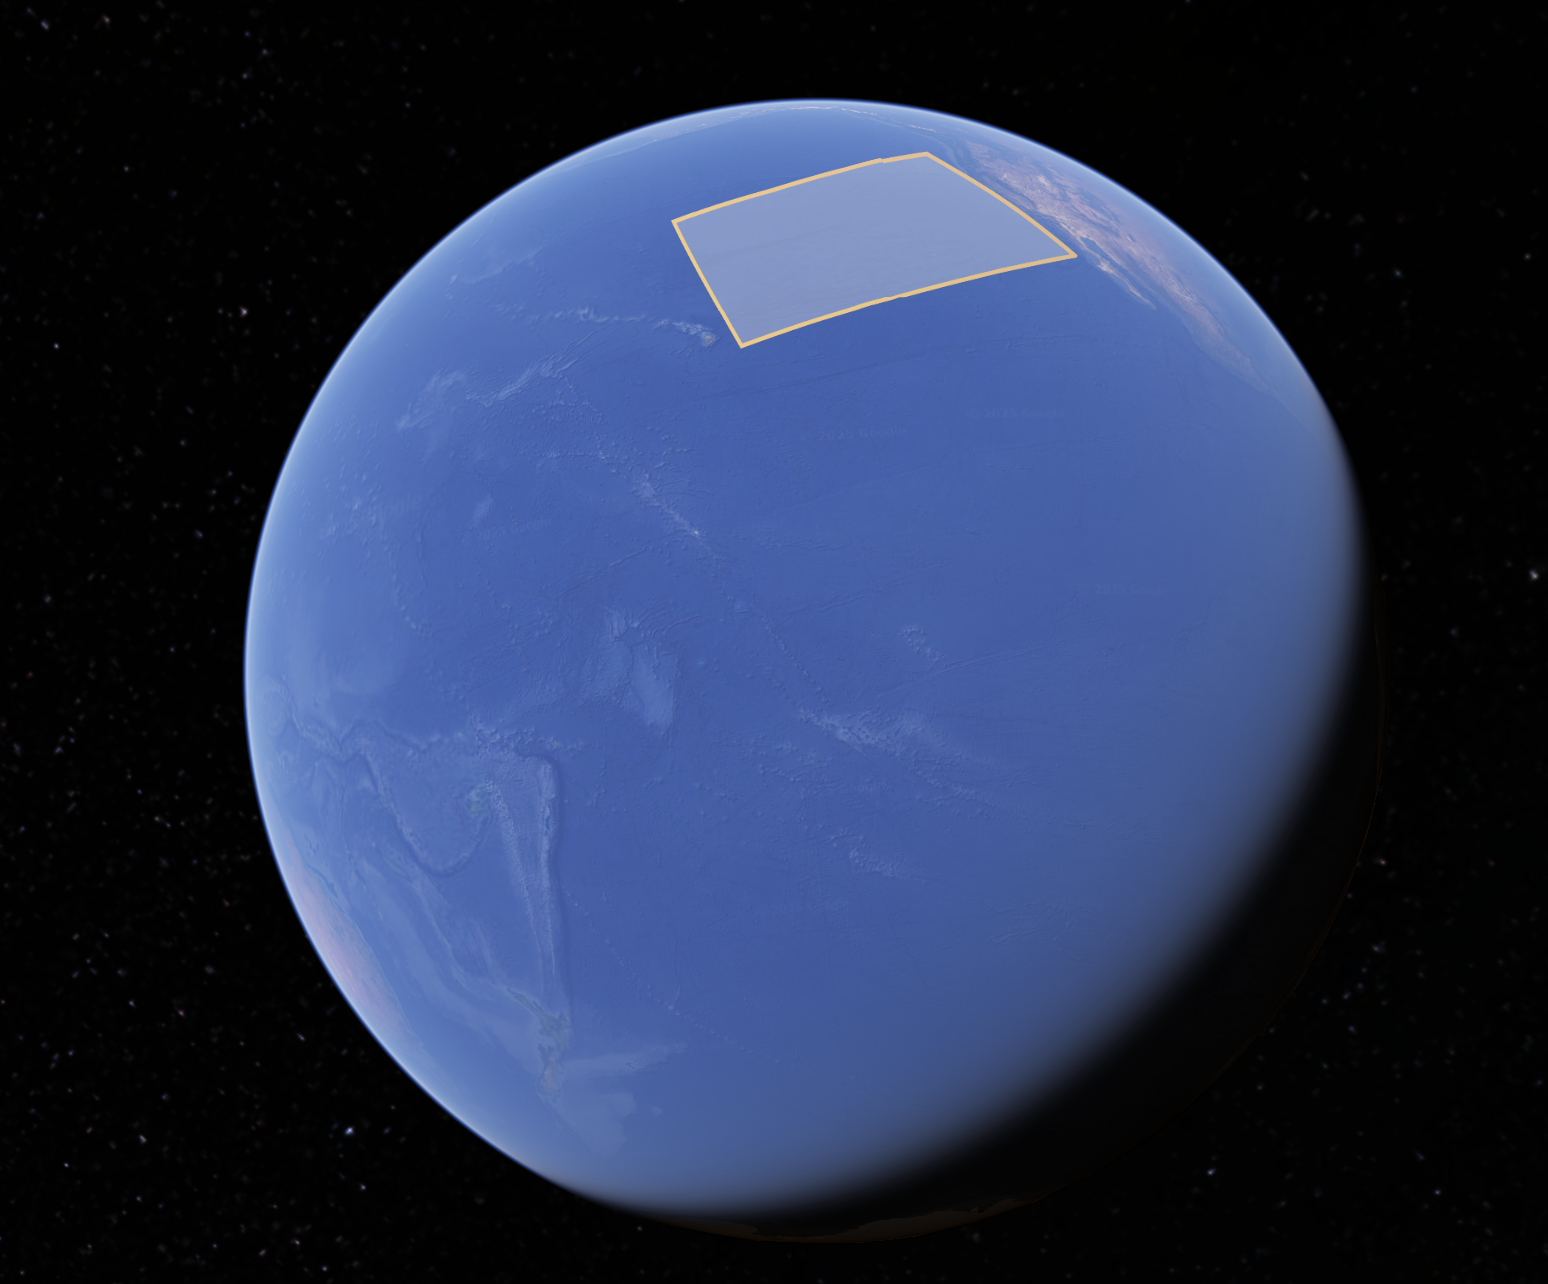
The Pacific is huge. The US 100x array could probably be done with minimal climate disruption, but if every country on earth did something like this, we’d start to run out of room.
The amount of sunlight that hits the earth is about 1E4x what we use. So humanity could 100x the amount of energy it uses and use ~1% of the sun’s energy that hits the earth. This is around the upper limit, any more than this would almost certainly start disrupting the climate. Thankfully, about 1 billion times more sunlight does not hit the earth than does hit the earth. So should we need more energy, we can start assembling the Dyson Sphere and have effectively endless energy overhead.
Too little demand:
What actually is the makeup of the demand for energy that brings us to 10x or 100x our current usage? US energy consumption per capita has declined over the last two decades, why would that reverse?
This is worrisome to me. If manufacturing limits are the most likely bottleneck on the supply side, insufficient use cases are the most likely bottleneck on the demand side. Since 1973 in the developed world, we’ve reengineered our economy to run not on energy, but on information, with financialization and digitalization as the results. Cheap energy may not matter much to the economy of the “developed world”.
That being said, the developed world, and America in particular, is notorious for its insatiable consumption. We tend to buy the nicest cars and biggest houses we can afford. Cheap energy is going to deflate the cost of pretty much everything, meaning you can buy more for the same price. It’s hard to imagine Americans won’t continue to consume as much as their means allow.
The entire world living at the American standard of living would 4x world energy consumption. So this is a good start. But how would we advance the energy use of the leading edge countries? There are only a handful of countries that use more energy than the US per capita; those with small populations and huge, energy intensive, oil refining capacity, like Qatar, Singapore, and the UAE, and cold (high heating demand), rich countries like Iceland, Norway, and Canada. These aren’t models that makes any sense to copy en masse. There is currently no next step of industrial civilization beyond the US level of development. We need to create that next step.
When energy prices drop, there are two types of increased demand. There are the use cases that we currently have but we do more of them. We would HVAC our houses closer to 68 degrees all the time, we would drive and fly more, we would use more energy intensive materials like aluminum or magnesium. As costs drop, we will reengineer our industrial stack to use more energy and less capex. This is all normal short to medium run elasticity of demand.
Then there are completely novel things only possible because of that cheap energy. The most exciting opportunities are in long run demand elasticity. We might start climate controlling entire cities. We might desalinate rivers and irrigate deserts. We might start using self flying cars. We might build nations of digital brains.
I’ve found a handful of good proposals for how to use cheap energy.
- Casey Handmer’s thoughts
- Tyler Cowen’s thoughts
- Eli Dourado and Austin Vernon’s thoughts
- Rob West’s thoughts
There are lots of good ideas about how to use cheap, abundant energy, but at this point, they’re all speculation. It’s difficult to predict what technologies the numbers will and won’t pencil for ahead of time and what customers will actually want.
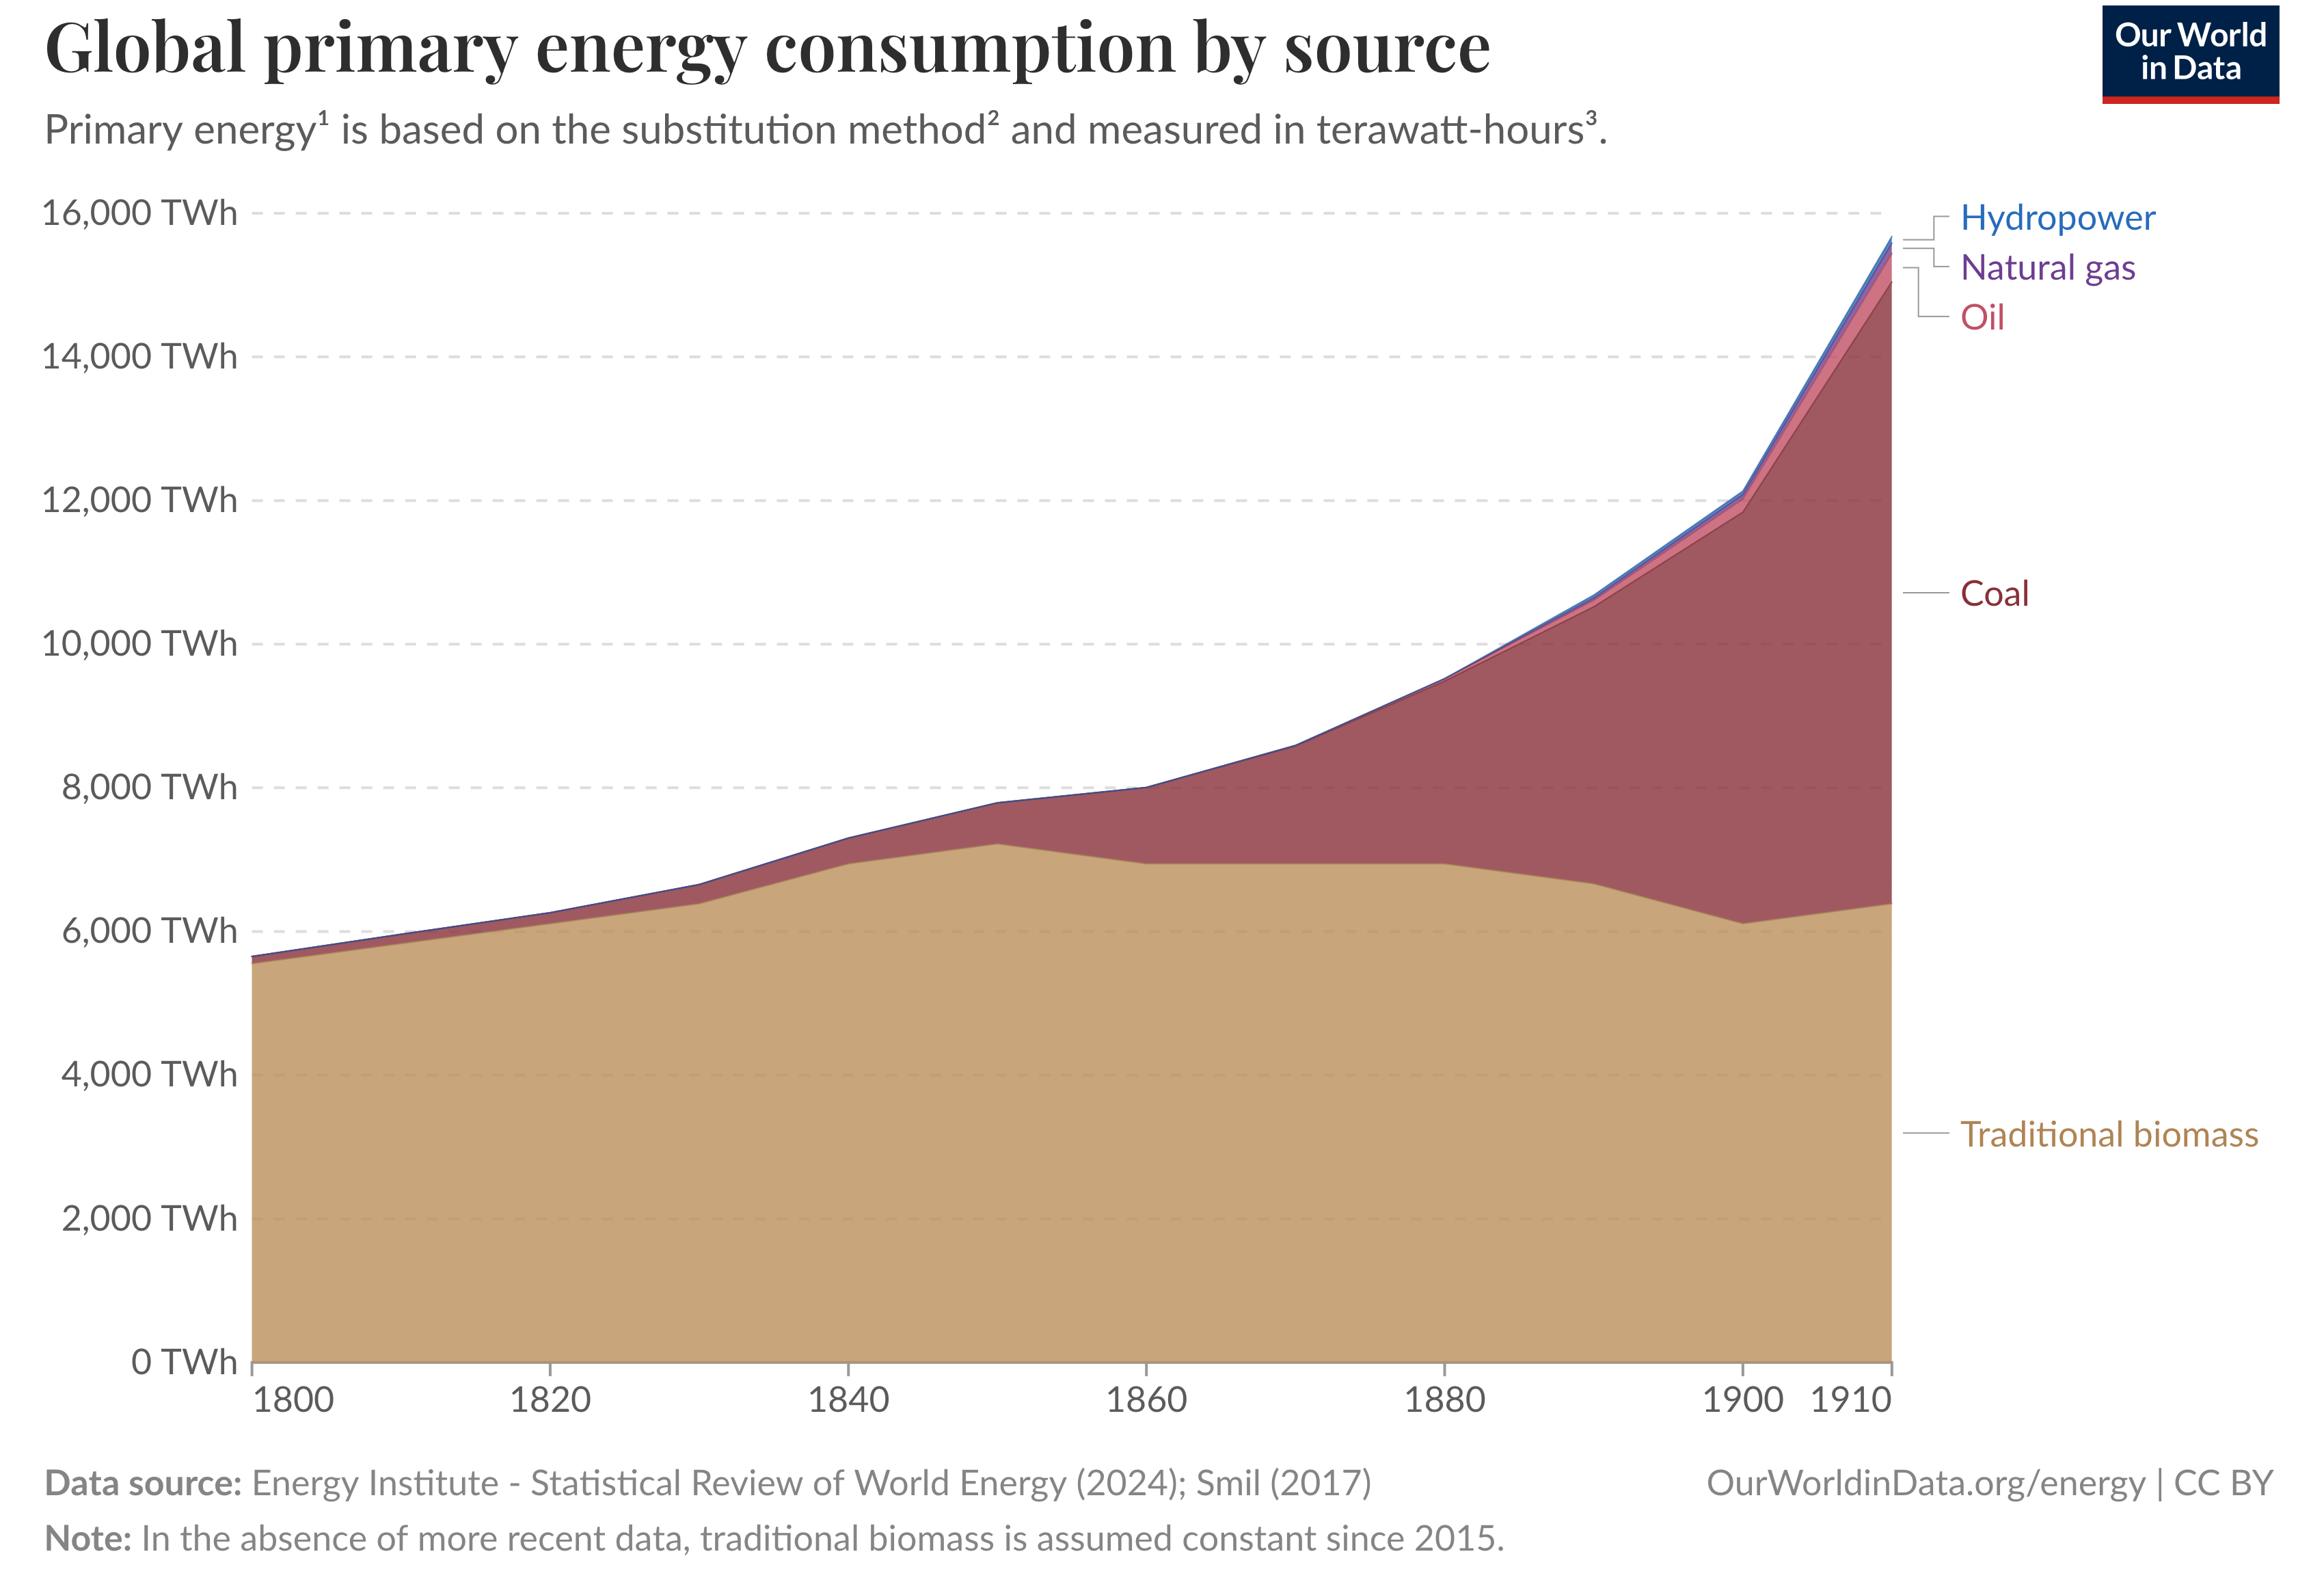
However, we can look at the last time that energy was abundant, unconstrained by supply, and cheap for an extended period of time: the post WW2 worldwide economic boom from 1950 to 1973. This is the fastest sustained period of economic growth the world economy has ever seen, before or since. It was broad-based; few countries didn’t experience increased standards of living during this period. It affected both those devastated by war and those unscathed. And it was all only possible because of cheap oil from the newly discovered Persian Gulf deposits. Nearly all of the massive growth in energy demand was met with oil and gas. Oil was much cheaper than even coal; it was used for everything, even electricity generation.
From the end of WW2 to 1973, energy demand naturally grew exponentially, but the reserves being discovered remained so much larger than demand that prices held steady or continued to fall. Before the late 60s, oversupply was a chronic problem in the oil industry. Both the Texas Railroad Commission and the Seven Sisters used cartel pricing power to keep prices artificially high and slowly lower them in the face of more oil than they knew what to do with. Even at artificially high prices, it was the cheapest energy in history to that point.
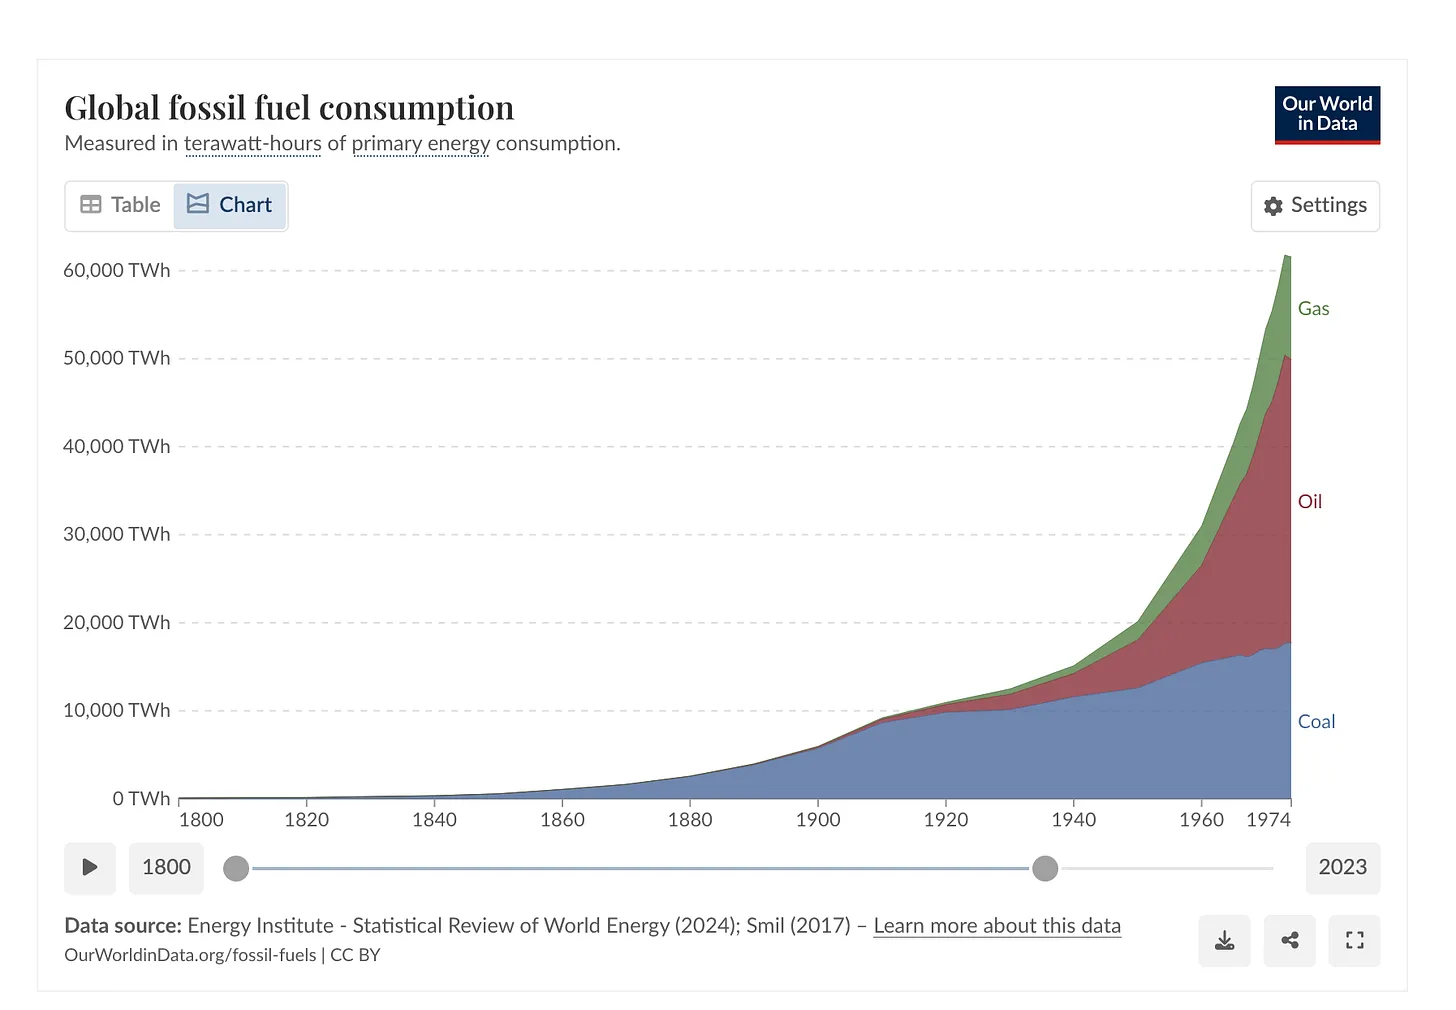
Look at that demand pick up post ‘45!
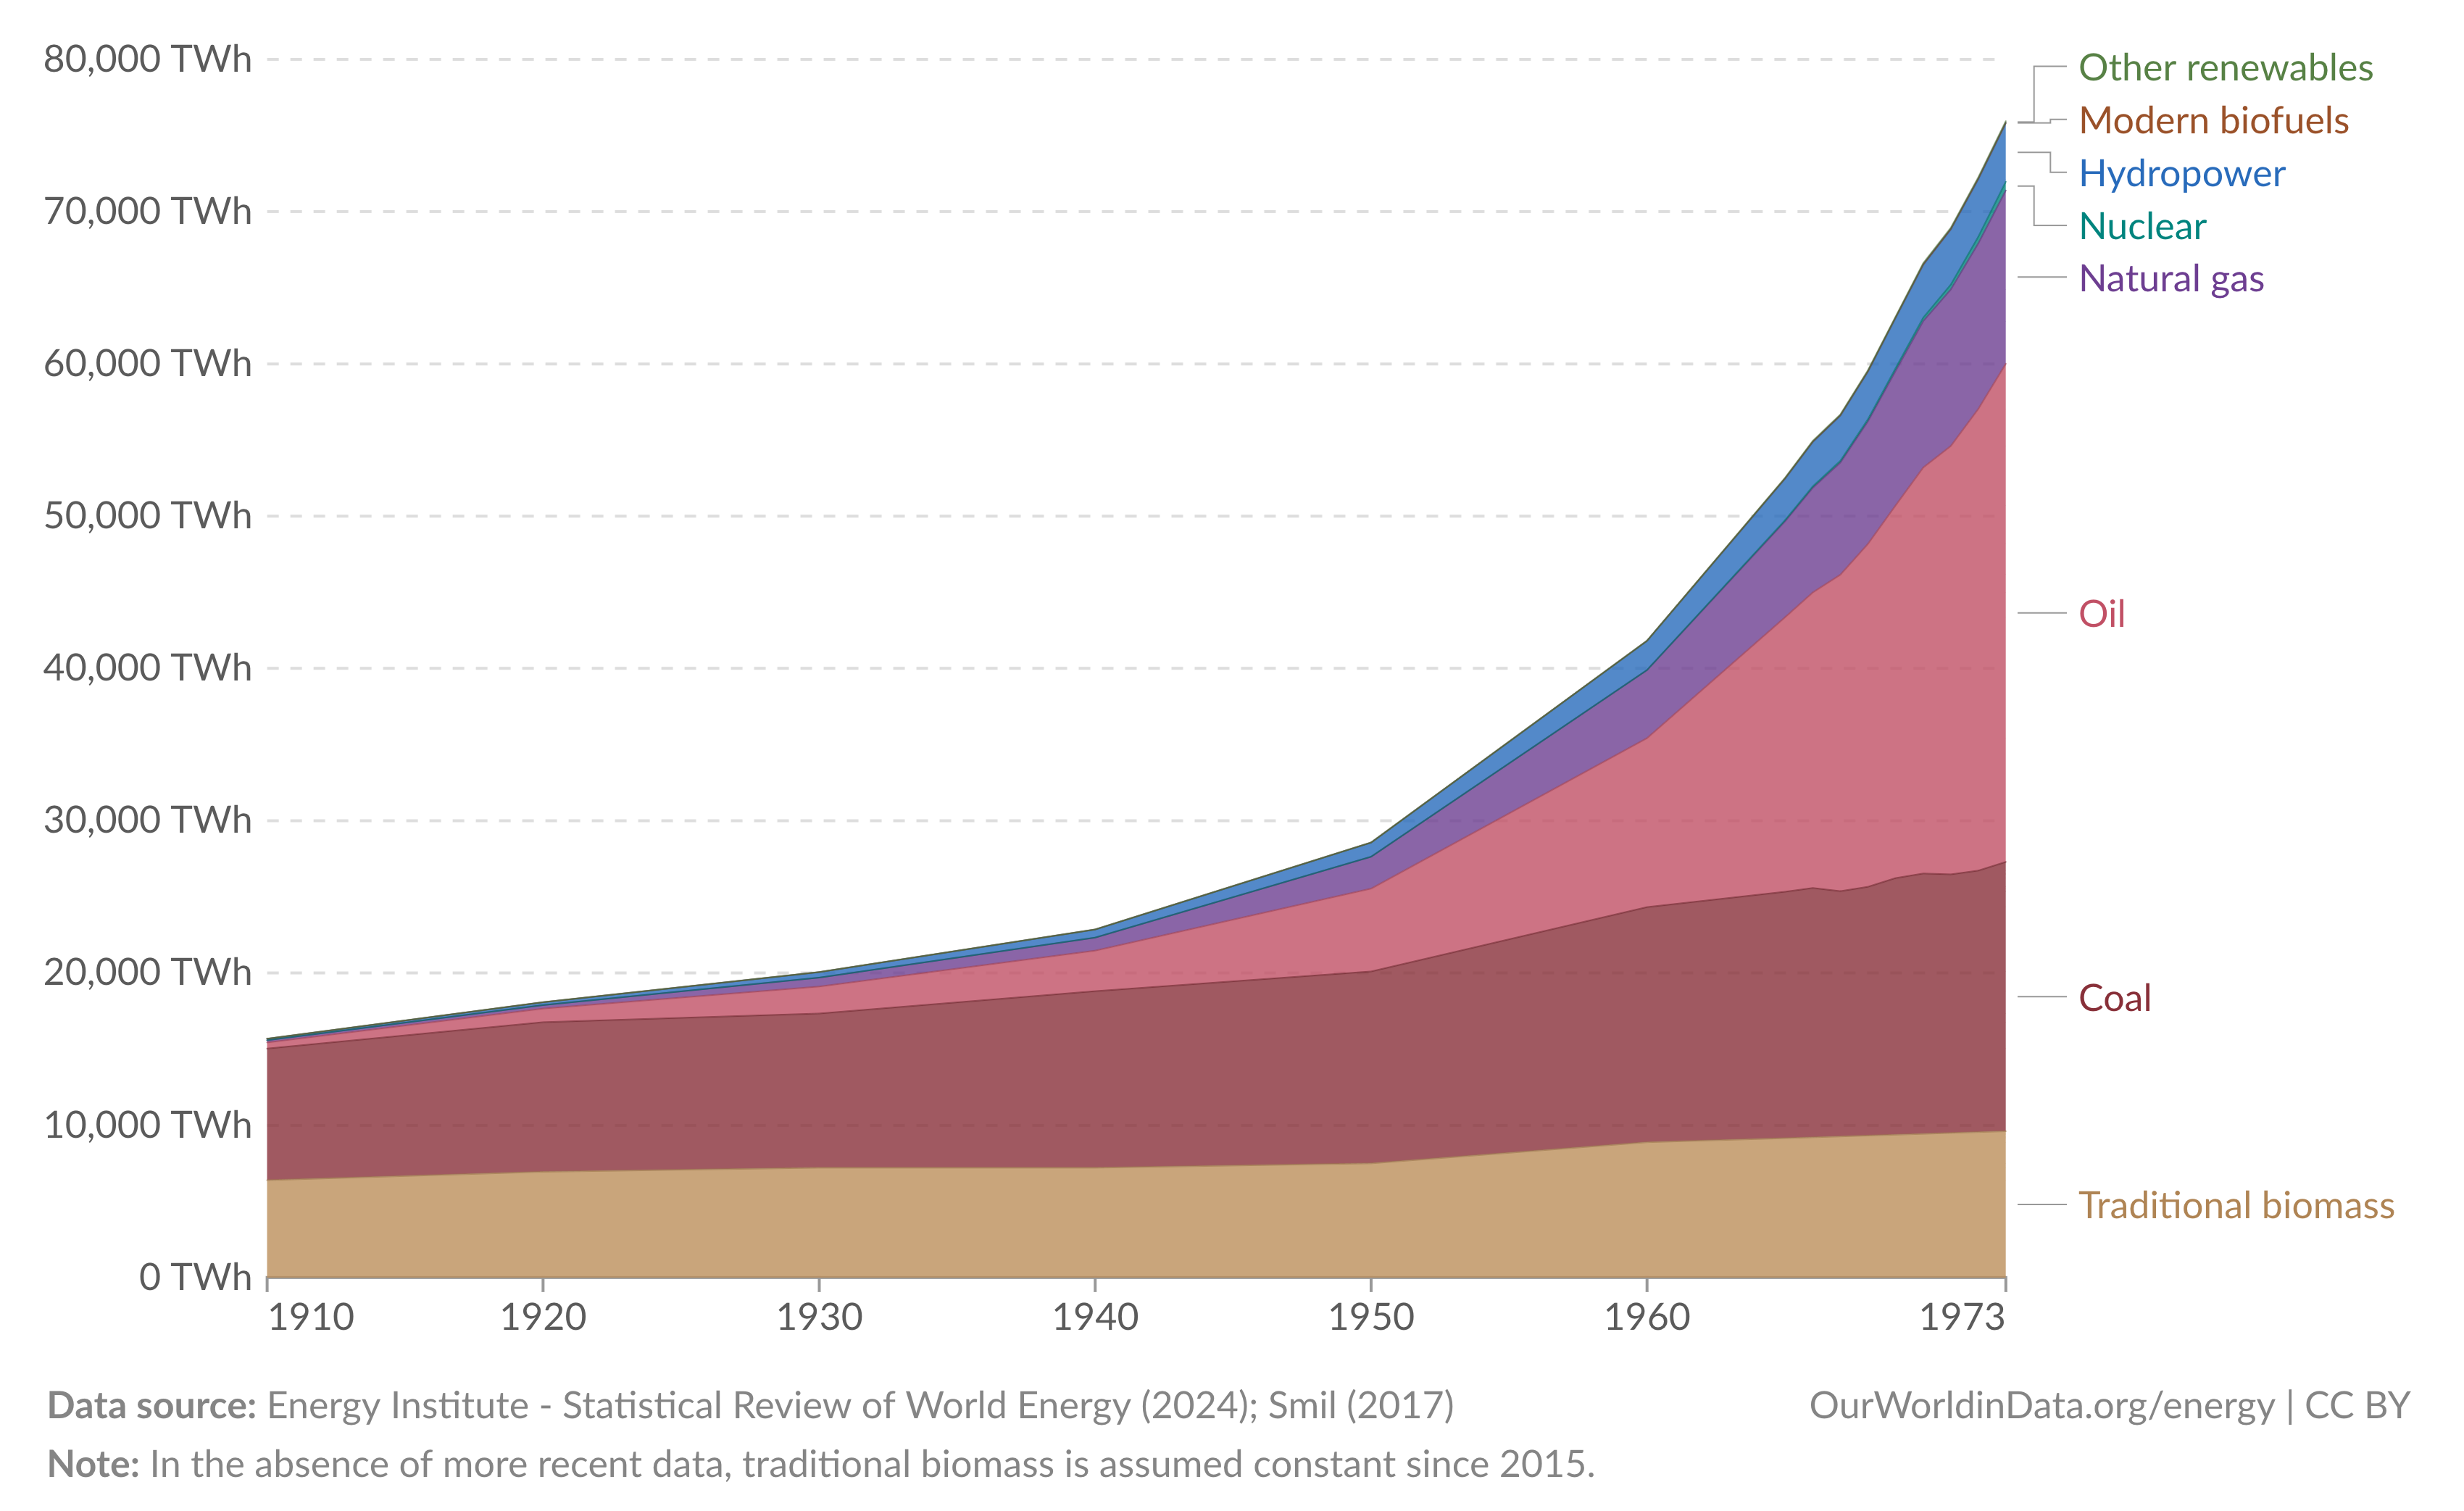
Towards the end of this period in the late 60s, the oil industry started feeling a supply squeeze as they reached the end of the cheap and easy reserves. A few years later in 1973, OPEC took advantage of this and constrained production, embargoed Israel’s supporters, and shot energy prices through the roof.
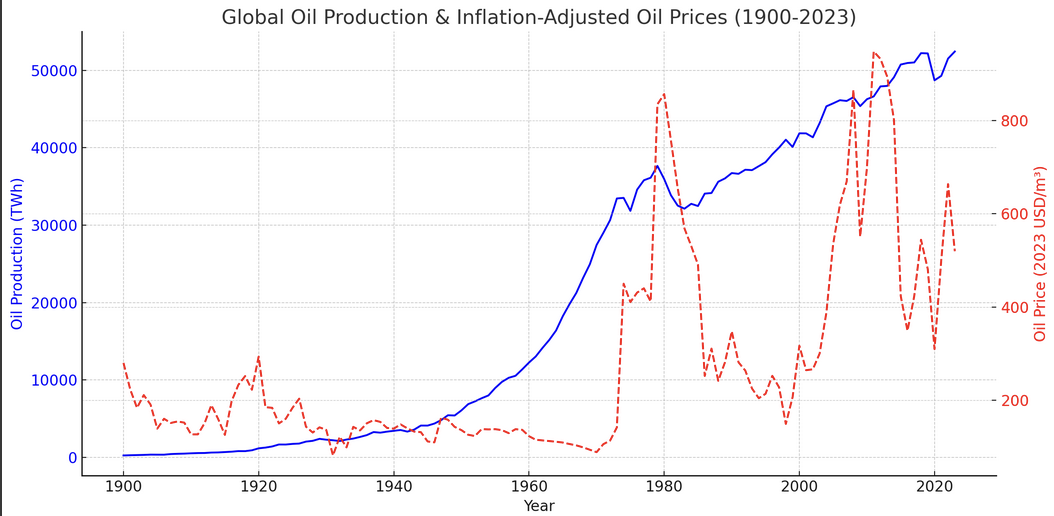
From Our World in Data
And that was that, the era of cheap, abundant energy was over. After the 70s, supply and demand for limited reserves of energy ruled the day and set the energy price. Additional reserves were found, not gushing out of the plains begging to be used, but under the 60ft waves of the North Sea or the frigid tundra of Alaska.
Consumption rose, but not exponentially, and not any faster than the population grew. There is a clear deviation from the pre-1973 exponential that becomes even more apparent when adjusted per capita.

A complete and total stagnation until the coal-fired rise of China two decades later
This oil-fueled “Golden Age of Capitalism” is exhibit #1 for how inexorable the demand for cheap energy can be over extended periods. If we never ran out of cheap oil reserves, it is hard to believe that exponential demand growth would have ran out either.
Solar has even better economic properties than oil. Solar gets cheaper the more you use of it, not more expensive. Will the exponential demand boom be even stronger under the solar regime?
It’s worth considering just how insane it is that energy is subject to an experience curve now. Energy is not like airplanes or other manufactured goods with experience curves, it a fundamental input to our civilizational machinery, just like compute is in the case of Moore’s Law. There is potentially no upper limit on the demand for it given a cheap enough price.
There are approximately two things in the universe, energy and matter. All previous experience curves have been configurations of matter. A solar module is a particular configuration of matter than produces energy as an output. This is insane! The entire history of energy is a story of increasing marginal cost of energy as the best reserves are depleted, culminating most dramatically in 1973.
Now, solar is a story of decreasing marginal cost of energy due to the aforementioned flywheel. A self-deflating energy source has never in history been seen before, and I think it’s an understatement to say it will result in a substantial increase in energy consumption in the limit.
Chapter 2. Riding the curve.
From this point forward, we’ll assume that the trend of solar decosting continues for another few decades. What does the world look like as this flywheel continues spinning and solar rides down the cost curve? And how do we take advantage of it?
Casey Handmer is by far the most important thinker in this area. He is the only person that has put together a compelling case for what a solar-powered future of abundance looks like, not just the undefined Abundant™ future so popular in the hardware zeitgeist right now. Radical Energy Abundance and Solar Applications Are The Largest Investment Opportunity In A Century are both must-reads. Stop reading this and read those if you haven’t.
When solar gets indisputably cheaper than all its competitors, humanity’s industrial stack will reconfigure itself around solar. This has happened thrice (coal, oil, gas) before and will probably happen twice (solar, fusion(?)) more given our current understanding of physics. The process of reengineering every industrial process to operate on solar electricity, not chemical heat, will be one of the largest undertakings our species has ever attempted. It will be substantially more difficult than any of the previous transitions, as those were basically just switching to combusting a new molecule with higher specific energy. This transition is what Casey calls the Solar Industrial Revolution (SIR), and will take place over the next 3-5 decades. This is in the top 3 largest opportunities of our time and by far the most undervalued.
What does reengineering look like? 4 forms of energy dominate energy use in human civilization: chemical, thermal, electrical, and mechanical. We are switching primary energy from chemical (coal, oil, gas) to electrical. In electrical applications, we lose roughly 2/3s of our primary chemical energy paying the thermodynamic penalty to convert to electricity, making electrical energy at least 3x the price of chemical/thermal energy. Turning primary chemical energy into mechanical energy again is a roughly 2/3s energy loss through prime movers. Chemical to thermal conversion is essentially (though not usefully) 100% efficient. Under the solar regime, this calculus changes. Electrical, thermal, and mechanical energy can be approximated to be the same price, since electricity can be put into a resistive heater at 100% efficiency or an electric motor at 90% efficiency. Chemical energy becomes the relatively scarce energy form in the new regime, with the conversion of electricity to e-fuels having not higher than 1/3 efficiency. The biggest changes during the SIR will be accounting for the newfound relative cheapness of electrical and mechanical energy and the relative expensiveness of chemical energy. It will probably take decades for the full implications of this to play out.
Where x/y is the cost of chemical/solar primary energy:
The fossil fuel regime | 1x: chemical, thermal. 3x: electrical, mechanical
The solar regime | 1y: electrical, thermal, mechanical. 3y: chemical
Where are we at today in this transition? Right now in the sunniest places, x ≈ y ≈ $0.16/kWh (when the sun shines). That means that electrical and mechanical energy derived from solar are today significantly cheaper than that derived from fossil fuels, and that it will still be a while before solar-derived chemical energy hits cost parity with fossil fuels (which will only happen when x = 3y).
That means that there are billion dollar bills laying on the floor today! Any electrical or mechanical energy intensive application should be able to draw their energy from solar arrays and print money by outcompeting those who don’t. What’s the holdup, then?
I see three main problems.
- Solar is intermittent. The capex of electrical loads is not free and must be utilized.
- The cost of a module is very much not the cost of a useful solar array
- The US lags massively behind on the solar cost curve and risks getting left behind.
I assume that loads here are using off-grid solar arrays, not the main electrical grid. Why will become obvious later: solar will become too cheap for the grid. A mere 60 miles of transmission raises prices by 1.5c/kWh, not a problem with today’s electricity prices but it makes solar economics on grid impossible. In the US, transmission costs are around 4c/kWh, multiples the cost of a solar electric kWh.
For an example electrically energy intensive process, we’ll take the chloralkali process, which produces chlorine and sodium hydroxide from electrolyzed sodium chloride. The unit economics of the products are a combination of the amortized fixed capital cost of the electrolyzer and other parts of the plant as well as the variable costs of energy and material inputs. Basically all industrial plants today are run with maximum uptime, and chloralkali plants are no exception. Why do industrial processes hate blackouts? At first pass, any time not running the plant is where money isn’t being made, and you need to make a predictable amount of money to pay back the debt used to build the plant. Furthermore, you can’t run your process in steady state if you have to deal with blackouts, which creates huuuuge engineering challenges having to ramp up and down and run at different multiples of full power, all of which increase costs and lower efficiency. Some processes, like aluminum electrolyzers, freeze and completely ruin the plant if they turn off for too long.
Solar doesn’t generate energy when the sun don’t shine and only has a capacity factor between 15 and 30%. In other words, there’s a “blackout” roughly 75% of the time when using solar energy as a sole energy source!
In the best case scenario, that means you’re making 4 times less money per dollar spent on the plant than you would be if you used a 24/7 energy source. You’d be hard pressed to find an industrial process that can stay competitive using cheaper energy but only making 1/4 the output and sitting idle 3/4 the time. There’s some models we discuss later that quantify when it makes sense to do this.
Unfortunately, it gets even more complicated. Solar doesn’t just turn on for 25% of the time and off for 75%. It follows a generation curve that is almost never at peak power, ramping up and down as the sun rises and falls.
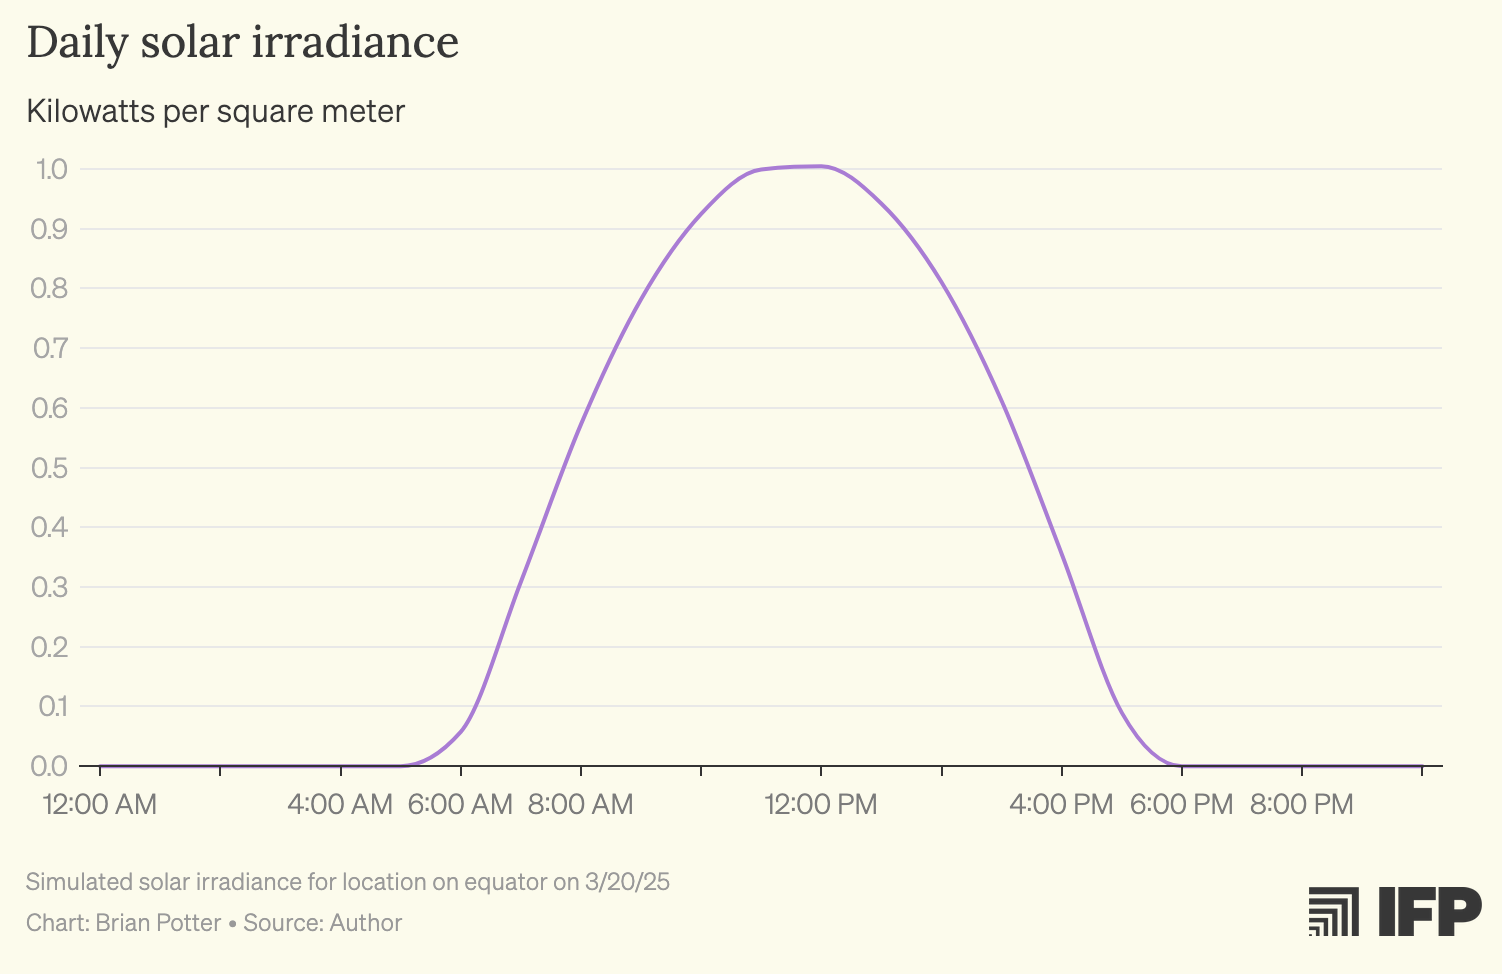
Not only is there no energy at all for half the day, your load has to throttle and run at fractions of its peak power for nearly all of the rest of the time. This is an extremely difficult engineering challenge. The frequent cycling fatigues parts, requires increased maintenance, and shortens lifespans. Not operating at steady state means suboptimal thermodynamic efficiency almost all of the time. Designing to accommodate for these things adds capital costs, at the very moment you’d like to be reducing them because of the low uptime. It can be done—internal combustion engines are able to do this—but it’s hard.
For added complexity, there’s seasonal variation.
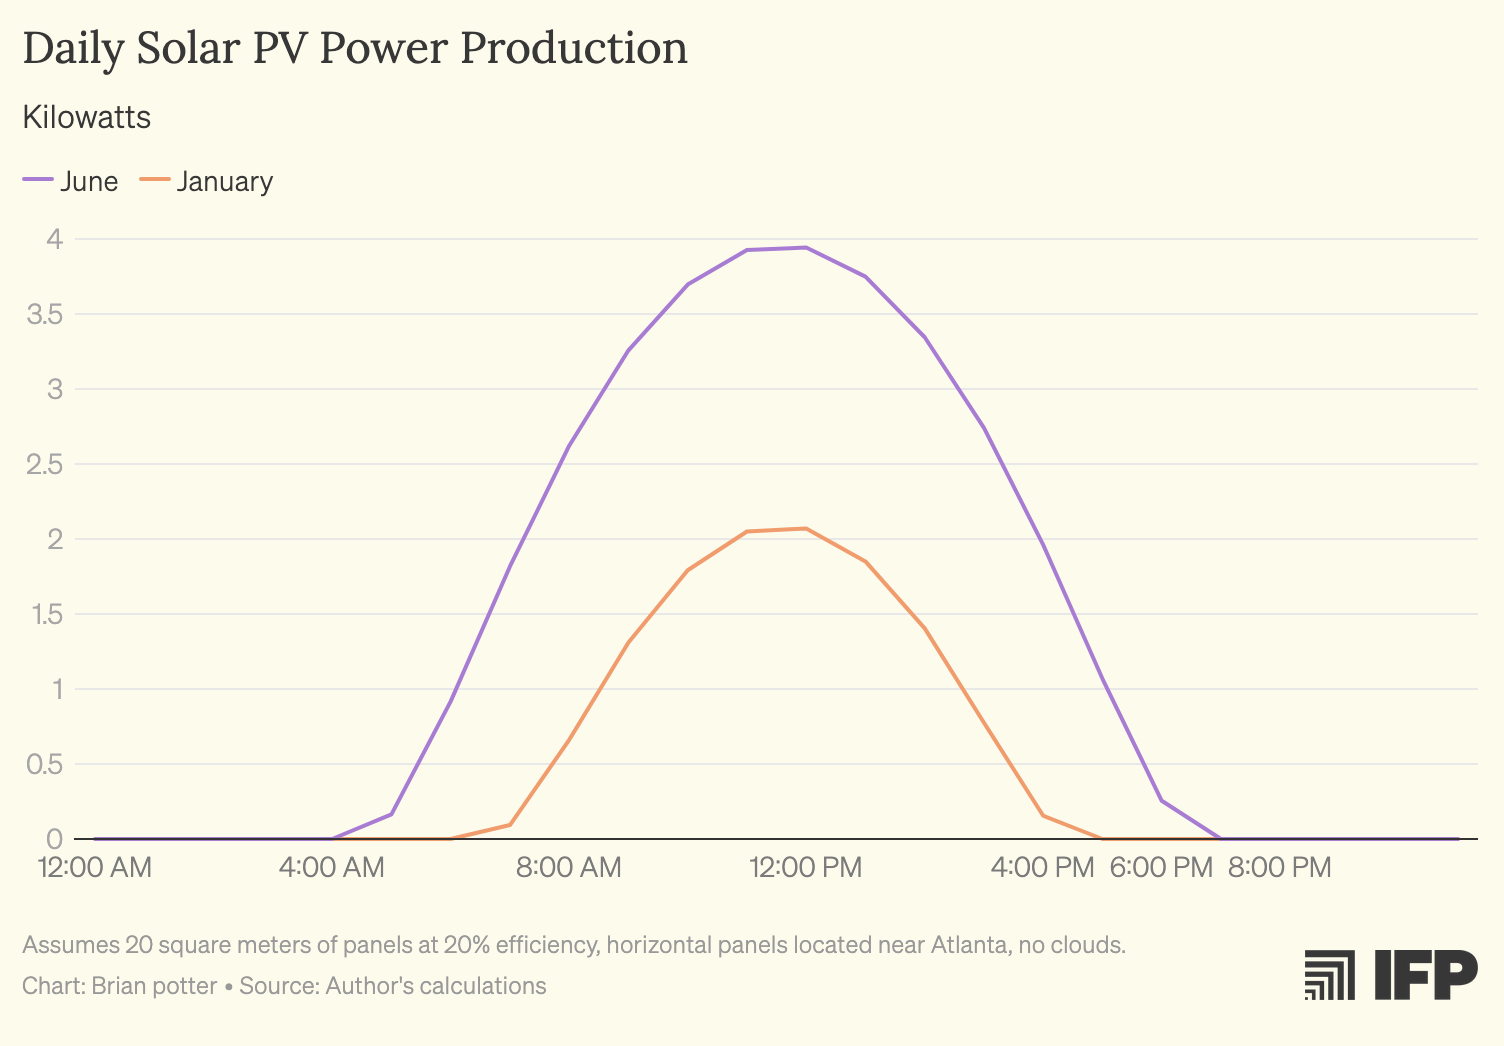
A summer day frequently generates multiples more power than a winter day, even in places with relatively mild winters like Atlanta. This means you either have to be running your load at half power during the winter or you can double the size of your array and curtail generation during the summer. The problem only gets worse the farther from the equator you go.
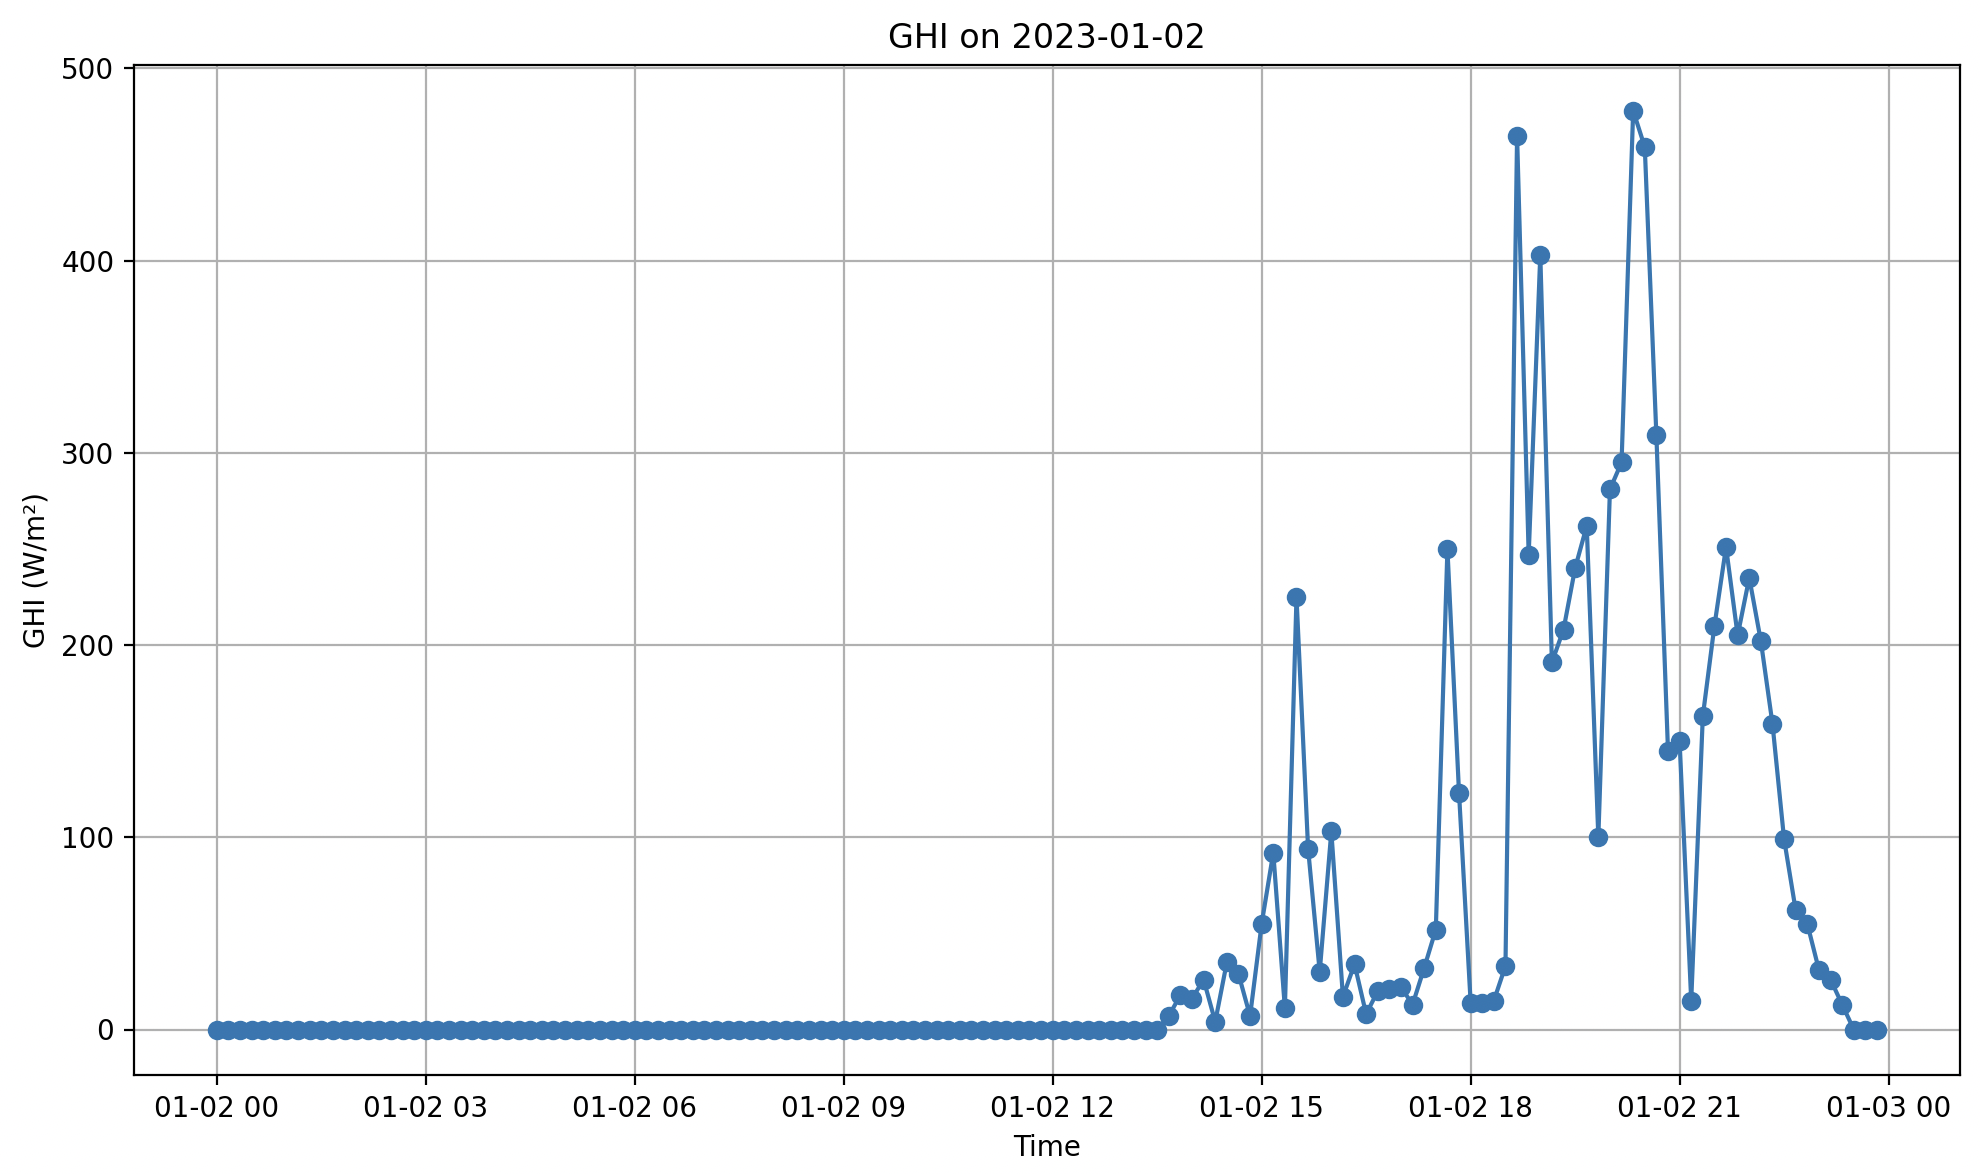
And all of that is what a perfectly sunny day looks like. Perfect days basically never happen in reality. By far the worst challenge is clouds. Try building something that not only ramps up and down over the course of a morning, but has to follow THESE generation profiles on every not perfect day.
College Station
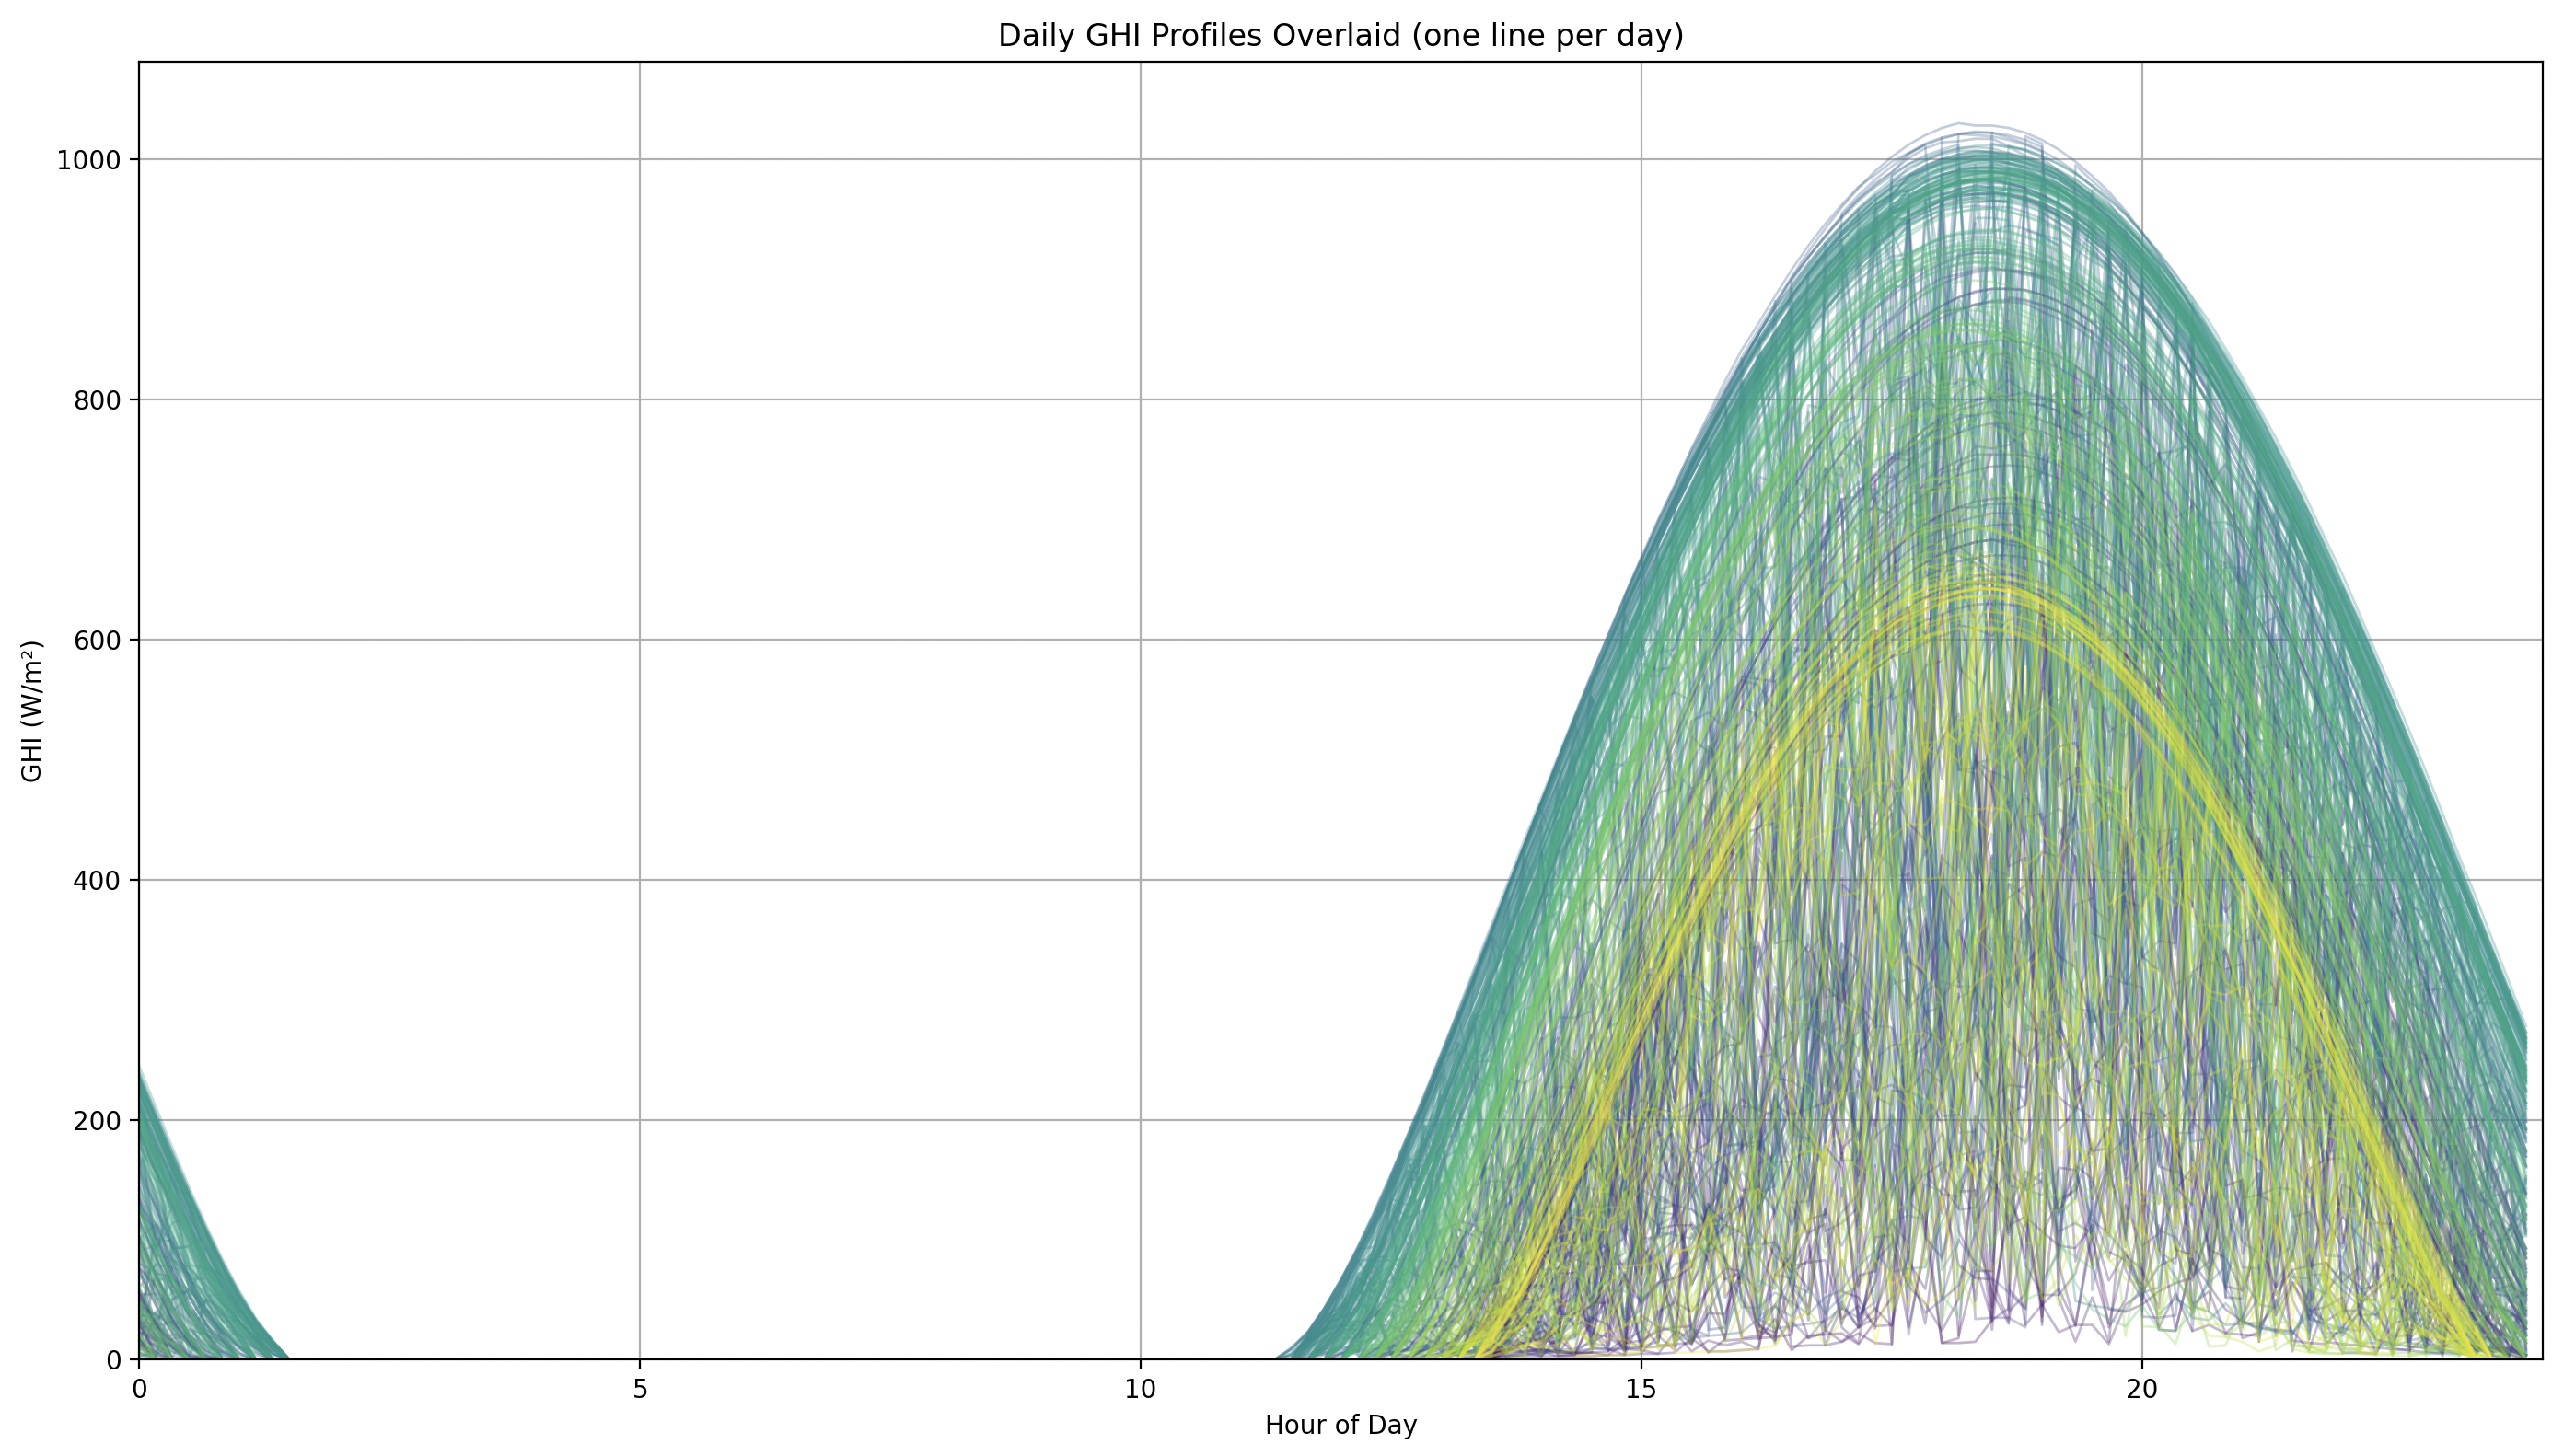
Each line here is the instantaneous power generation for each day of the year for college station TX, a pretty average us city.
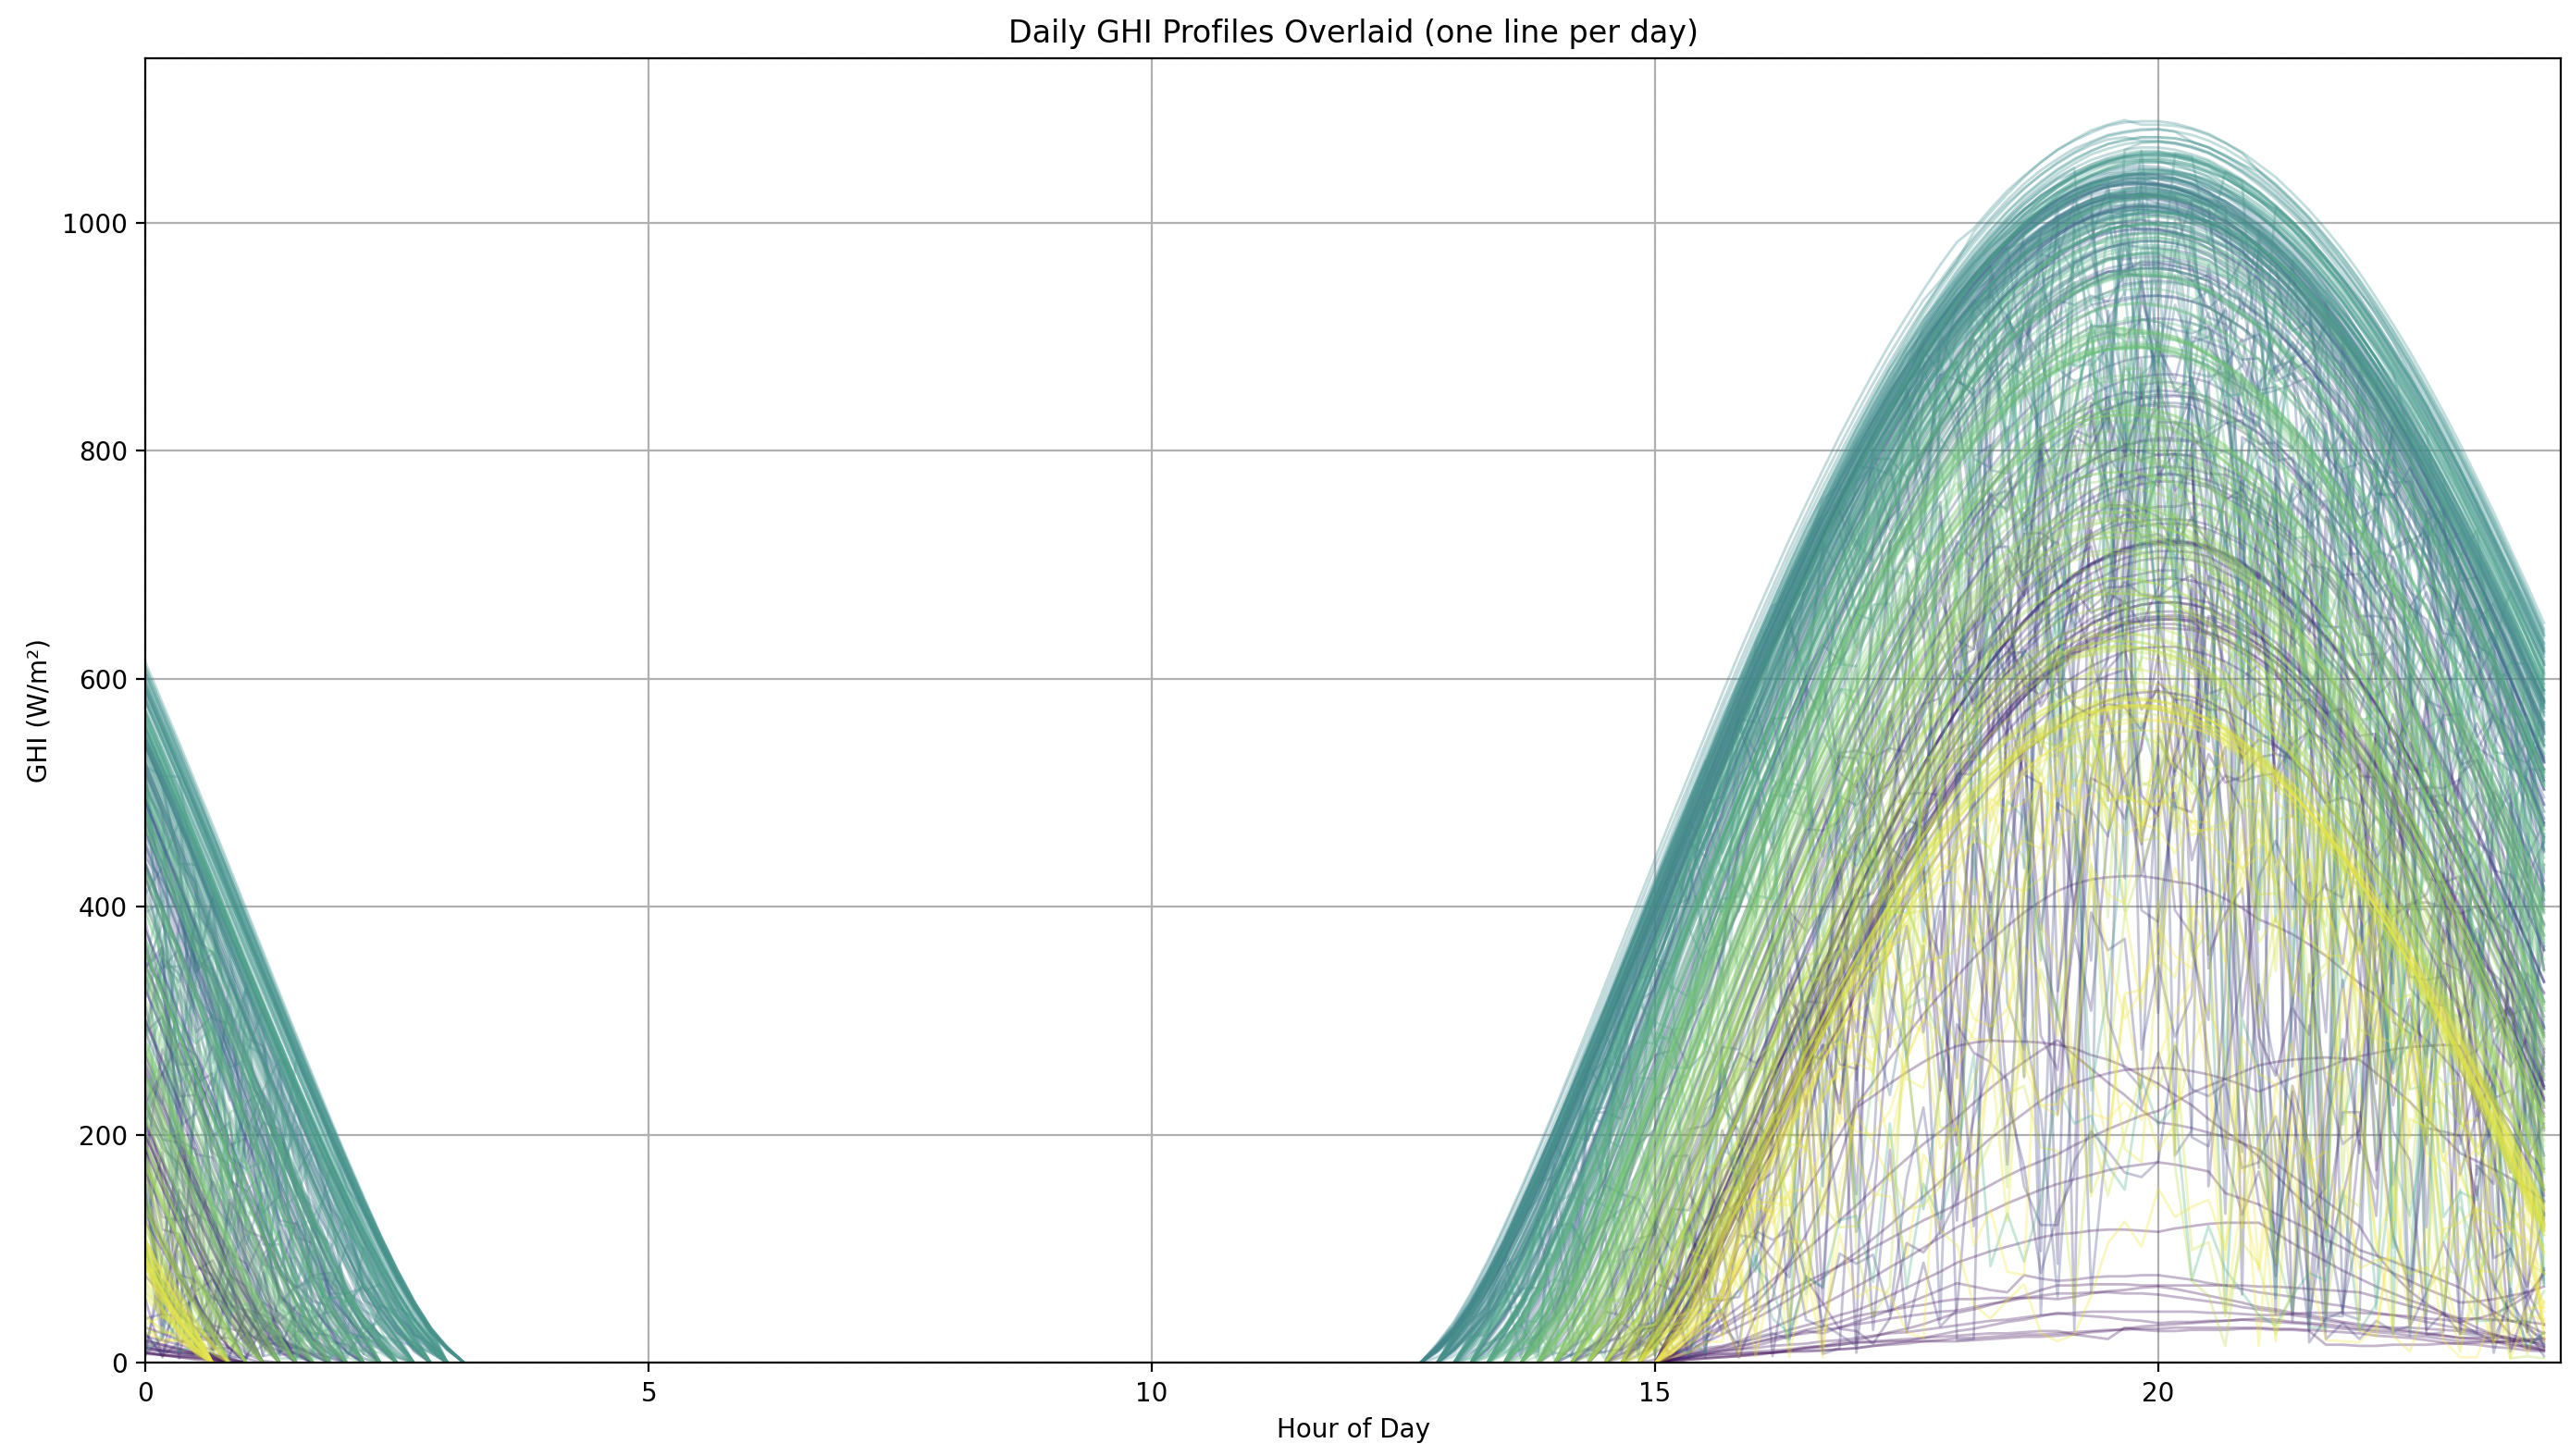
Even the sunniest place in the US, the Mojave Desert, looks like this.
Each day is different and largely unpredictable. Significant numbers of days have negligible amounts of power generation all in a row. Not only is average generation variable, so is its variance! Winters have far higher variance than summers.
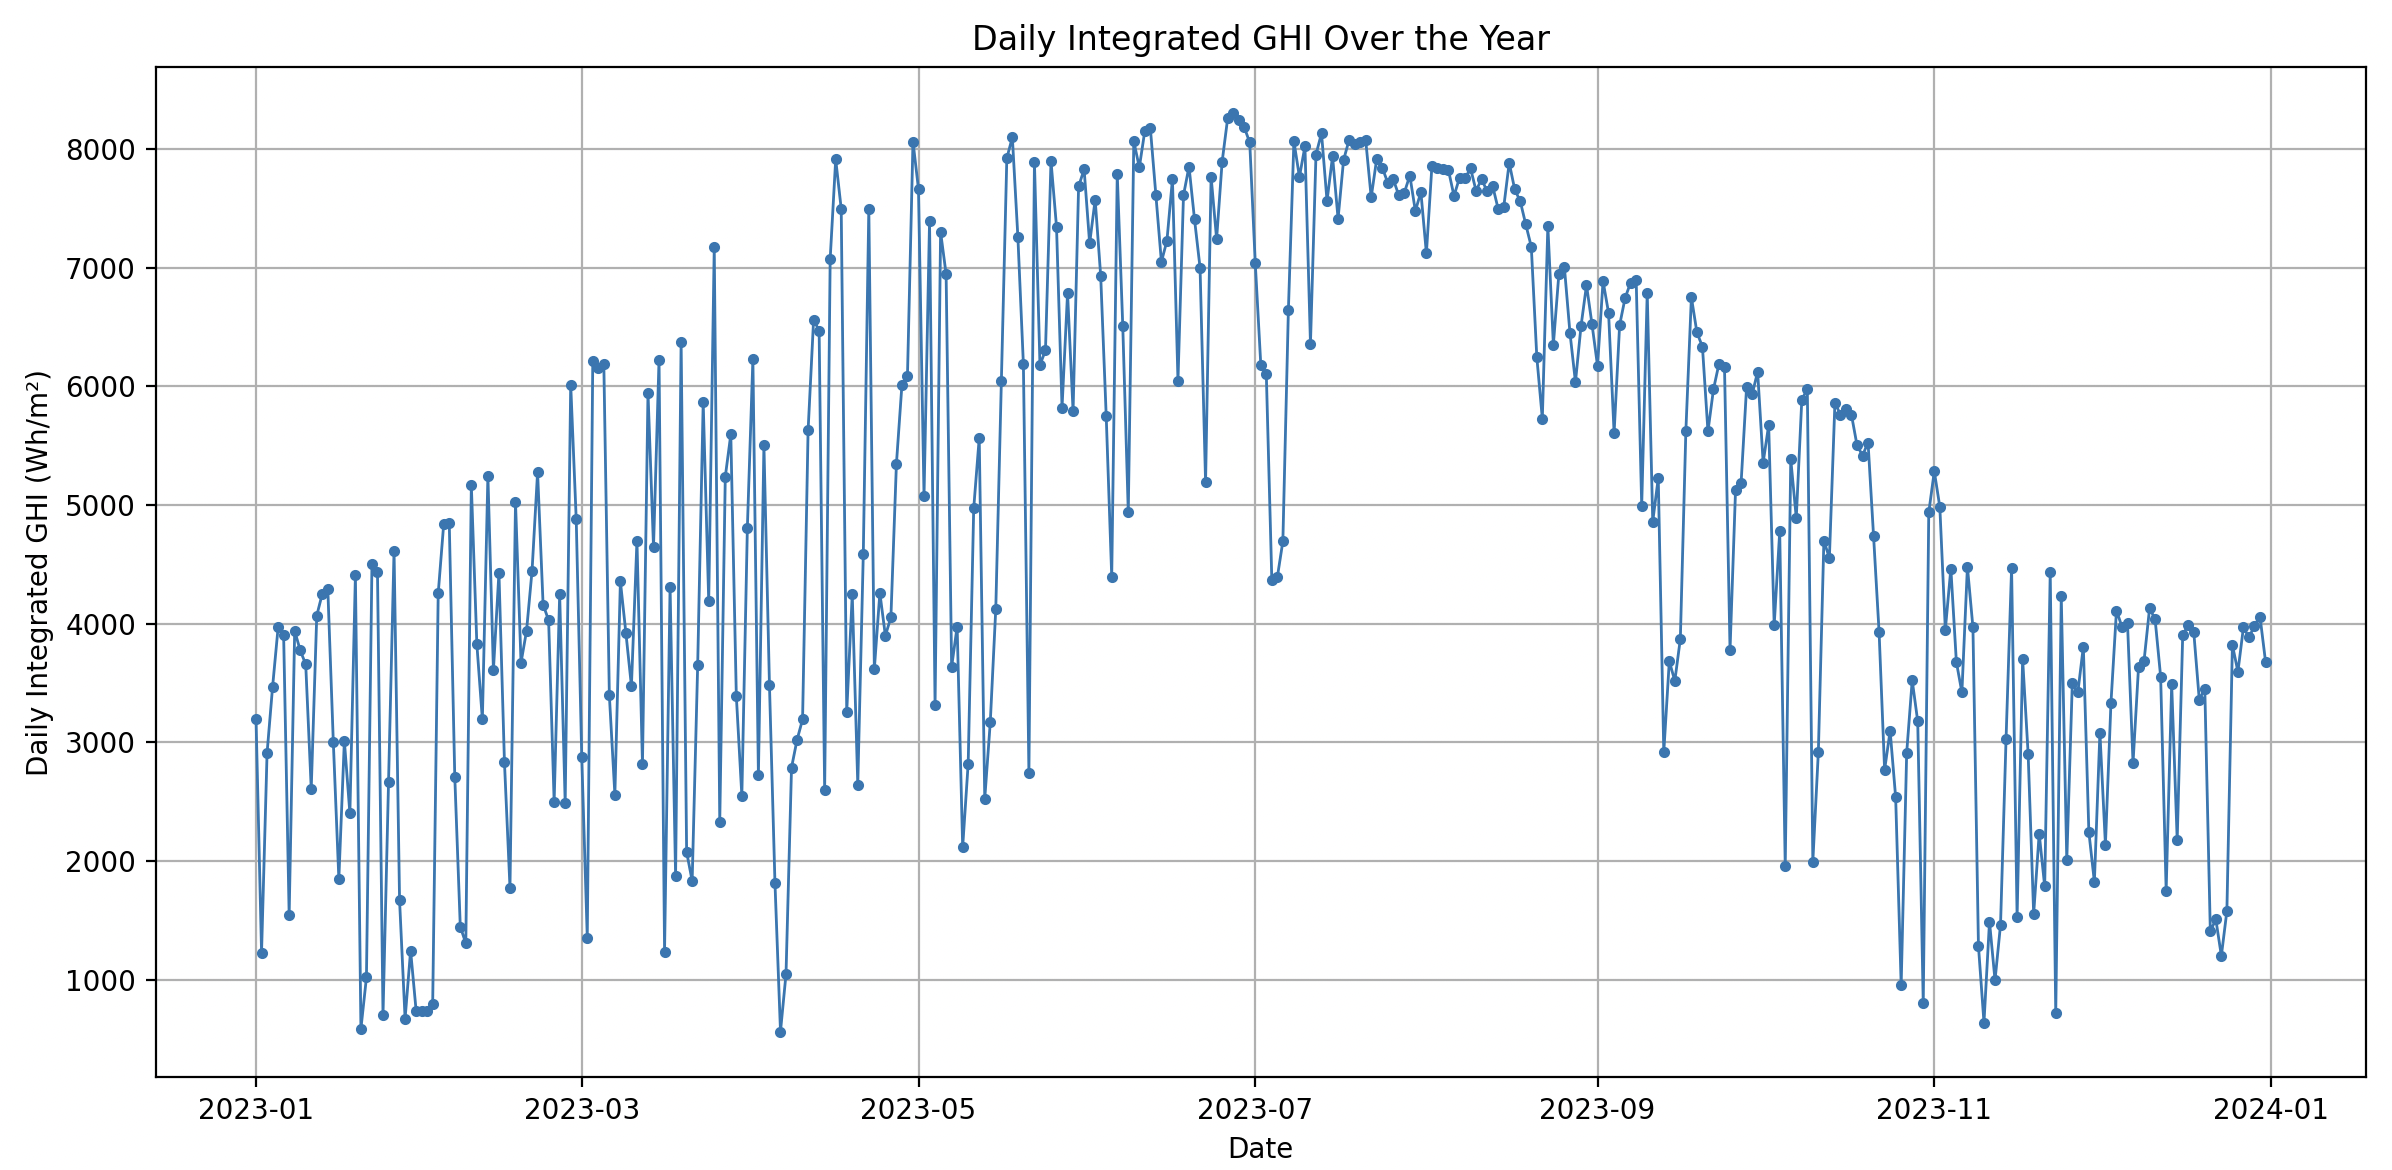
Here’s the cumulative power generation each day of the year in college station
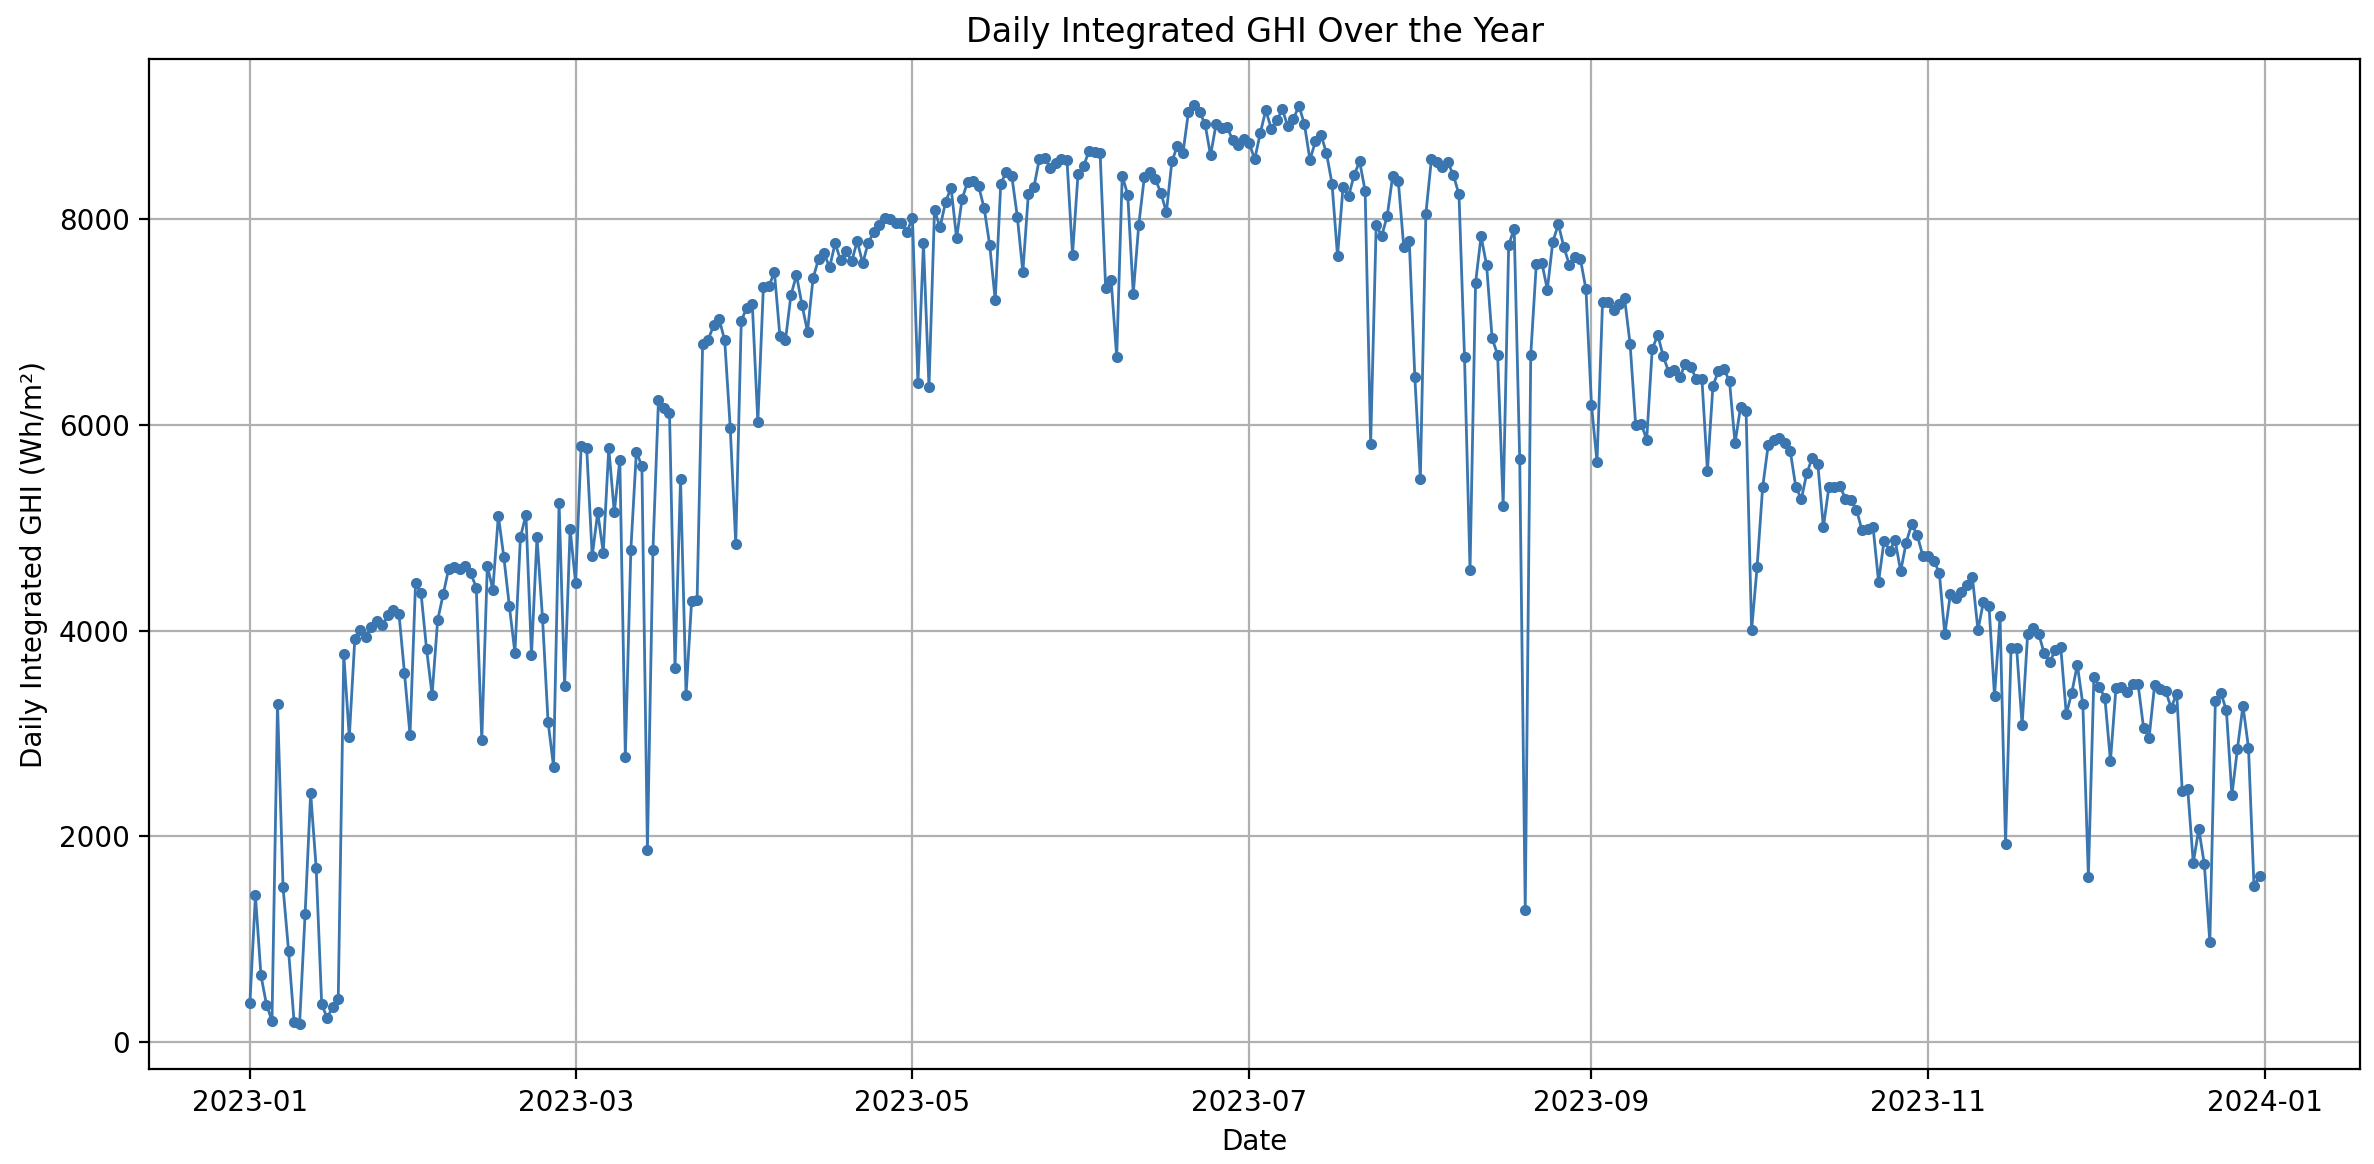
Mojave
No existing industrial load can handle this hell, from an economic or engineering standpoint. There’s two responses to this chaos. One is to try to create a purpose-built machine to deal with the constraints of pure solar power. The other is to try to make solar power as similar to traditional energy sources as possible.
Terraform is taking the first route, specializing in creating intermittent, throttle-able energy applications.
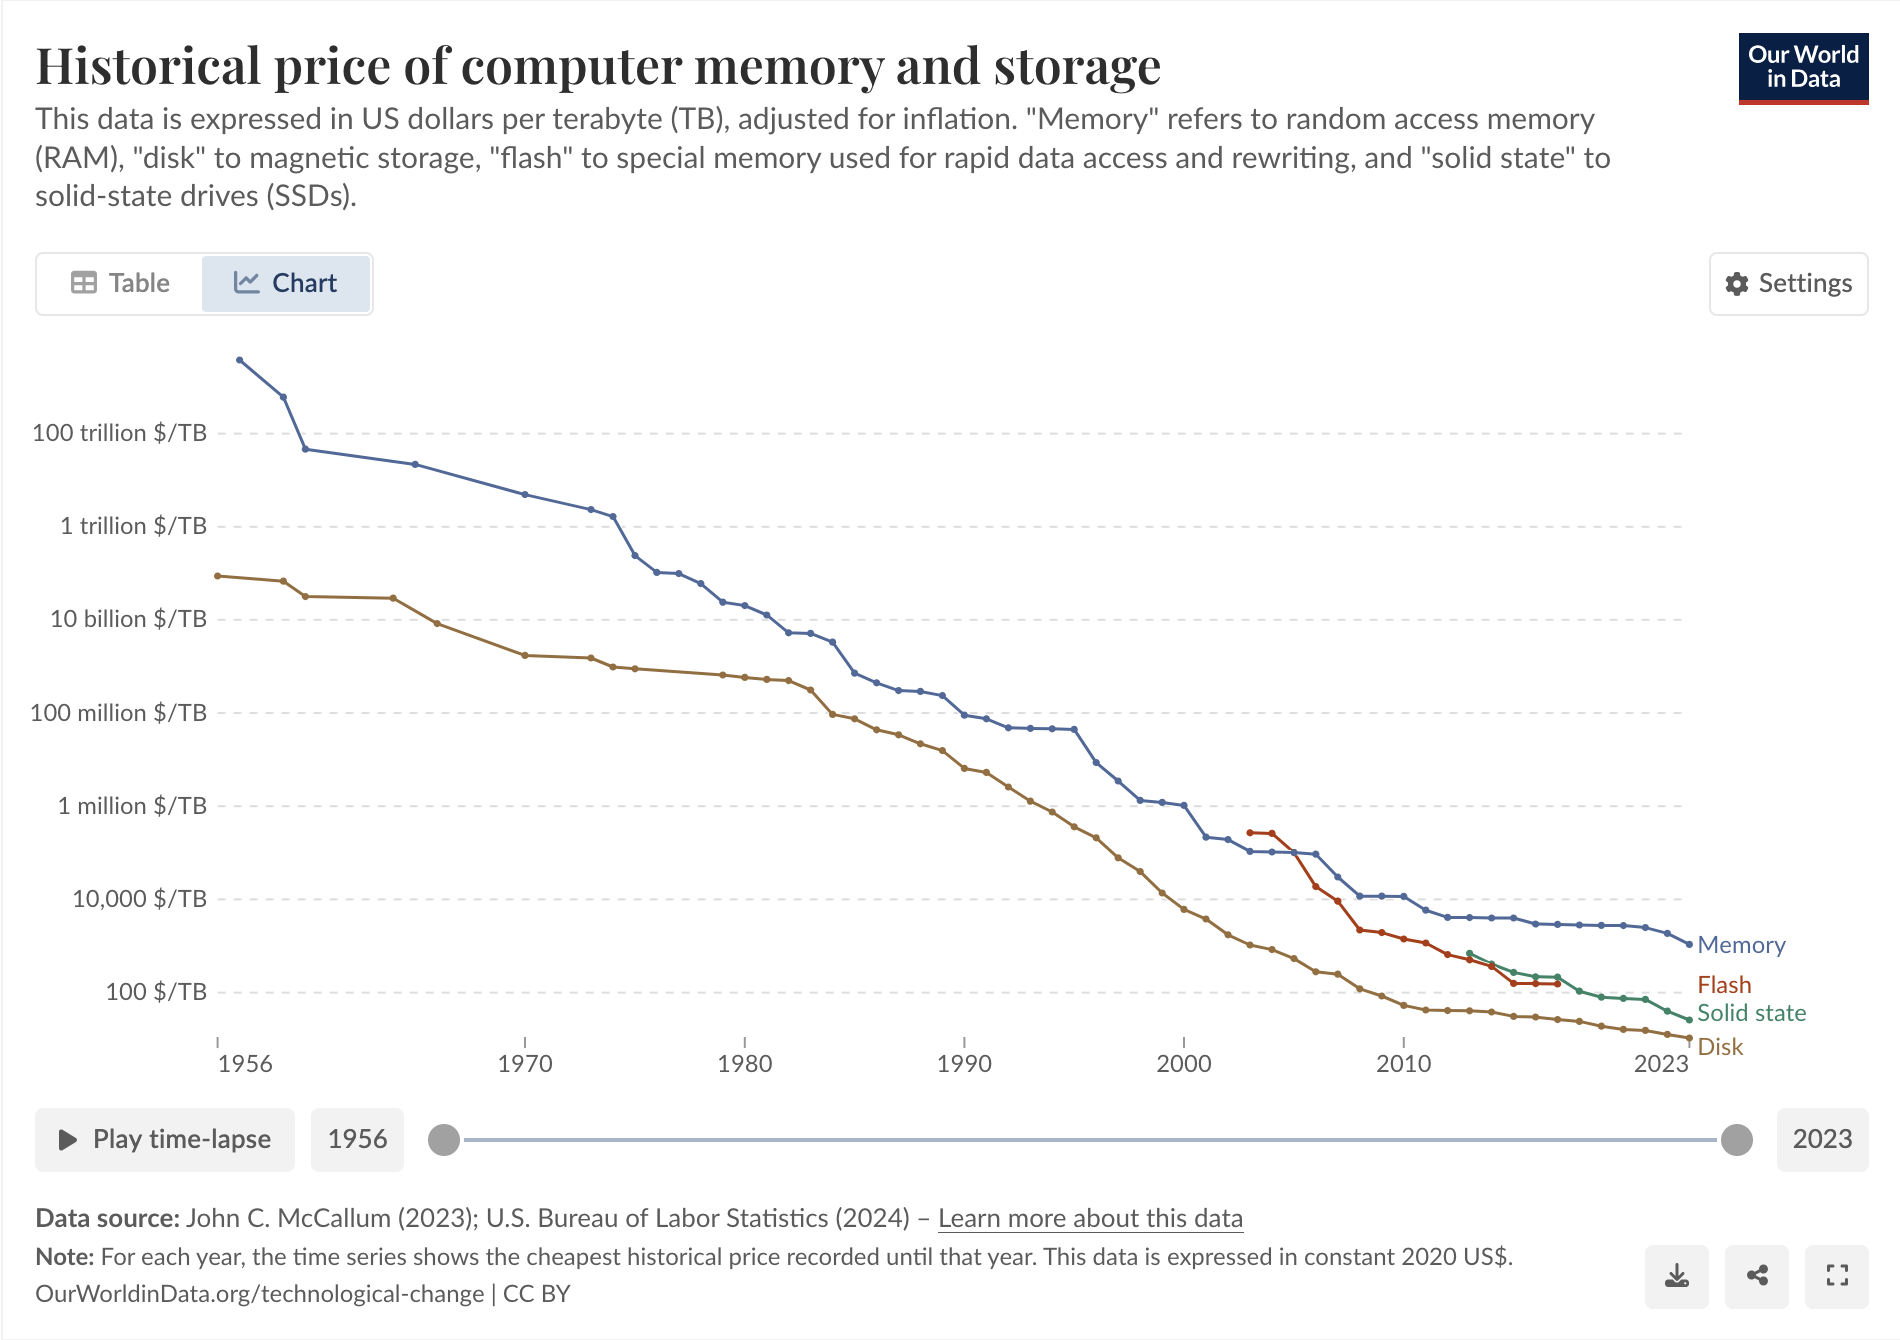
The other option is to use batteries and overbuild solar. Batteries are the most perfect complement to solar that could ever be asked for. They’re a variation and volatility elimination machine.
Thankfully, the only other technological building block keeping pace with the falling price of solar modules is their perfect compliment: batteries
Take the three types of solar intermittency above: the day-night cycle, the summer-winter cycle, and cloudiness.
With batteries, you can build 400% the necessary panels and use 3/4 of the panels to charge batteries that power the load steadily through the night. This adds significant cost, but creates 24/7 power. Day-night solved in all but the most extreme latitudes.
Seasonal variation is basically solved by overbuilding alone, batteries don’t make sense for infrequent discharges. Energy cost increases, but it’s really cheap to begin with. Seasonal solved in all but the most extreme latitudes.
You can also use batteries to shape the generation curve however you want. If you don’t want to deal with the generation curve and associated ramping, you can just turn it into a square wave. You can also use them to smooth the variation caused by cloudiness and transform it into a shorter square pulse for that day as it gets cloudier and cumulative generation declines.
Batteries take the chaos of solar power generation and turn it into a predictable stream of power an industrial load can accept… for a cost.
When do you pursue a intermittent or high-uptime build out?
Casey again comes to the rescue. Read Solar and batteries for generic use cases and To Conquer the Primary Energy Consumption Layer of Our Entire Civilization. Just be aware he has very generous assumptions on his numbers. Also worth reading the Scale Microgrids 24/7 solar/battery/gas datacenter white paper for a detailed look at very high uptime applications and how you integrate gas backups.
This is the all important graph. There exists a transition point in $/W of load below which it makes sense to run intermittently and above which it makes sense to run near 24/7.
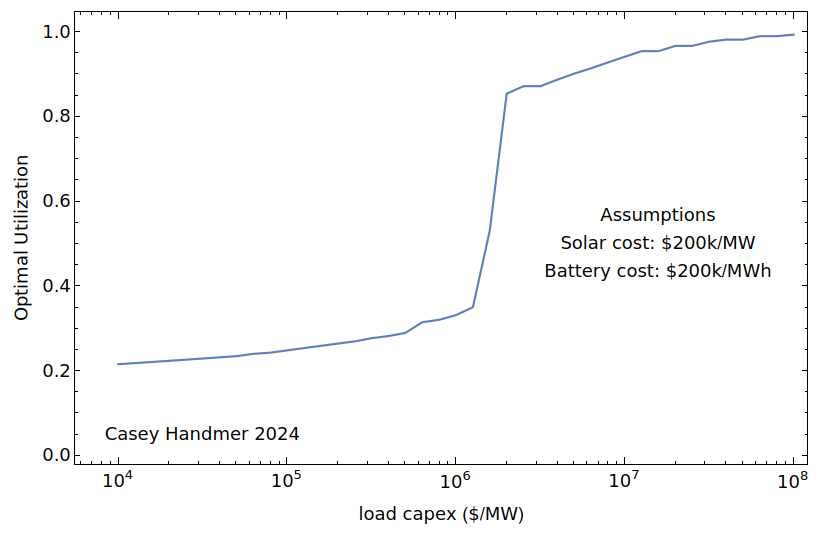
These are some looks at $/W of power and $/Wh of energy for different utilization in a solar + battery system. A good way to understand the pattern is at low utilization, you just put the panels down. Then you linearly increase the amount of batteries and the amount of panels to fill those batteries until 90% uptime and nearly an entire day-night cycle can be covered. Then you continue to overbuild the relatively cheaper solar panels ensure that those night batteries are filled up increasingly often as the days get cloudier.
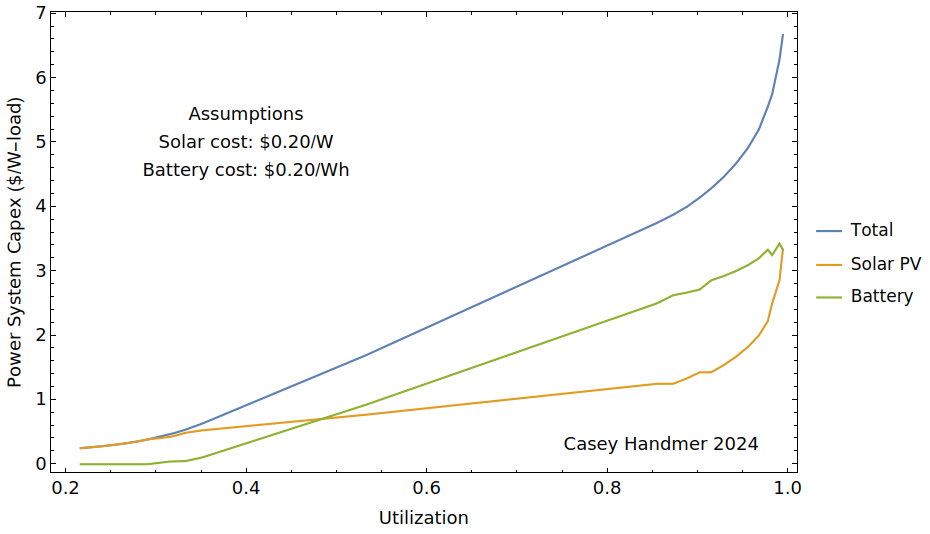
$/W of power.
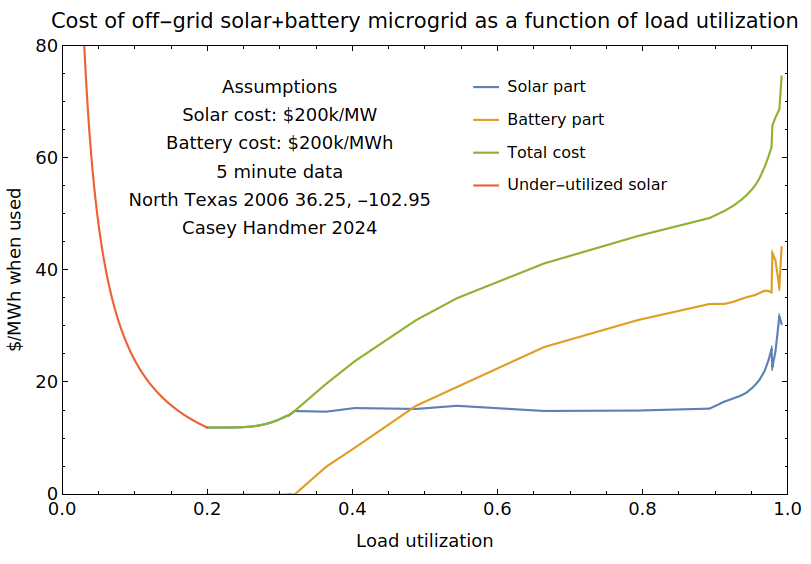
$/MWh of energy.
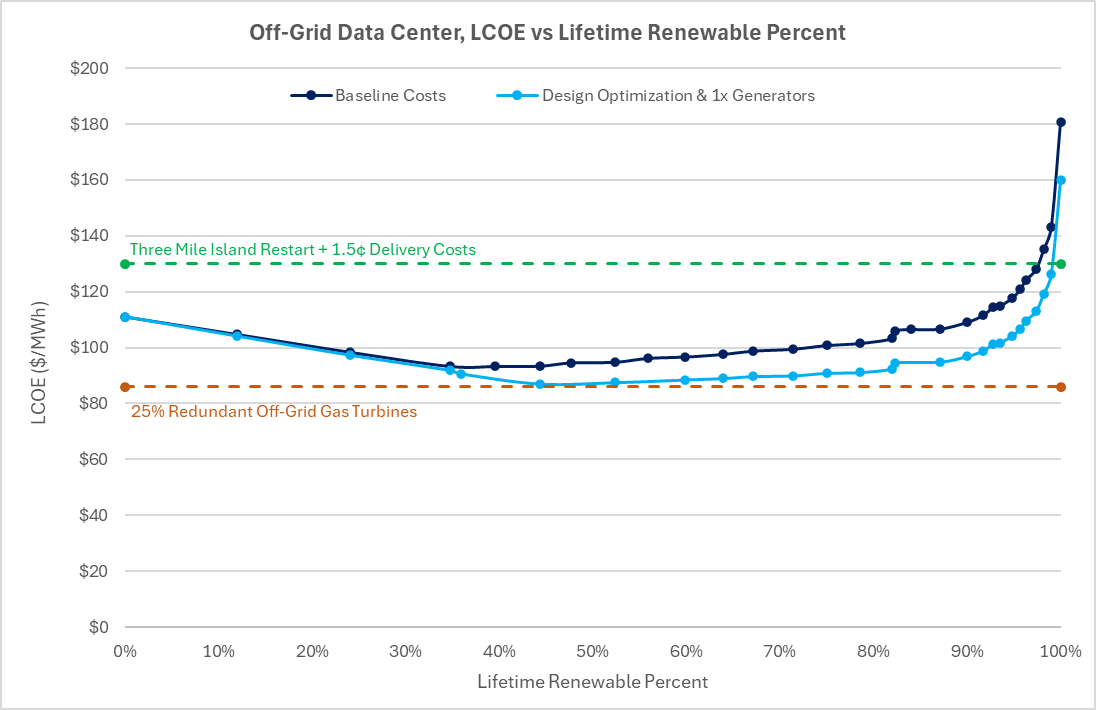
From Scale Microgrids. What percent solar of a microgrid is solar vs gas.
While intermittent loads are an interesting engineering problem and have the potential to be a profitable niche for products where energy is a very high portion of the final cost, I would wager that high uptime loads are going to dominate in the long term, just as they do today. Even though the cost of high uptime solar energy is something like 5x the cost of intermittent solar energy, most loads today are already higher than the $2/W cutoff. As the costs of solar modules and batteries continue to fall, high uptime loads will become increasingly favored.¹⁹ High uptime is where solar starts to look like a drop-in replacement for conventional energy sources. When high uptime hits cost parity, industrial civilization will easily transition to solar en masse instead of a hard engineering fight to make everything throttle with the rising and setting sun.
But right now, high uptime solar arrays are not cheaper than traditional electricity sources, to say nothing about chemical/thermal sources.²⁰ There is considerable uncertainty on what the true cost of high uptime solar electricity is. Optimistically it is a bit cheaper than industrial grid electricity (~6c/kWh). Pessimistically it’s about 3x that cost. But solar and battery costs will inevitably decline, between 15-20% per year if the trend since 2008 holds. Gradually over the next decade we will hit cost parity and the solar industrial revolution will take off like a rocket.
Where will the solar industrial revolution first take off?
A 5 year old would answer “the desert!” They’d be right.
The Sunniest Places on Earth are UnderratedThe sunniness of the Atacama/Altiplano is ridiculous. You basically could not make a sunnier place on the surface of the earth. It is high altitude and the sky is blindingly clear year-round; locals wear extensive protection at all times to prevent inevitable sun burns. There are multiple weather stations here that have never recorded rain in the past half century. This paper estimates the LCOE of solar in the Atacama to be less than 1.8c per kWh. This can almost certainly be lowered significantly. Some back of the napkin math puts that as nearly identical in cost to US natural gas and Chinese coal on a thermal energy basis, which are about 1.65c per kWh, and Icelandic low-grade geothermal at 1.5c per kWh. The average global horizontal irradiation (GHI) (the amount of energy that hits a horizontal surface) in the Atacama is about 7.2 kWh/m^2. That’s 10% sunnier than Namibia (the 2nd sunniest place on earth), 22% sunnier than the Mojave, 51% sunnier than the Texas Triangle, 77% sunnier than the Northeast Corridor, and 178% sunnier than the UK.
The advantage compounds with trackers. What stands out on this map?More important than how sunny it is is how not cloudy it is. This region renders solar’s greatest weakness irrelevant. Backups for unpredictable long stretches of cloudy days in the winter? Those stretches simply don’t happen.The following compare the sunniest place in the world with the sunniest place in the US with an average location in the US. (GHI data from NREL, Extended America GOES East dataset 10 minute intervals, for the year 2023)
Taken from near Calama
The hours are in either UTC or GMT and are a bit odd b/c of that.
Taken near Edwards AFB. Note the killer cloudy stretch in early January.
The initial ramp is the clipped the end of day being brought to the beginning due to the weird time zone. The cumulative value at the end of the day should be unchanged however.
Taken from College Station, in the Texas Triangle
In addition to it being sunnier in absolute terms, the number of days where generation is significantly obscured by clouds is stunningly low in the Atacama. Literally thrice in all of 2023 did daily generation dip below 4kWh/m^2/day. Whereas nearly a third of days in the Mojave and half of days in College Station dipped below 4kWh. Say there’s an engineering requirement that you can turn off your load no more than three times per year; what is the minimum kwh you can expect to collect daily under this assumption? It’s around 4kWh in the Atacama and 0.3kWh in the Mojave! These examples are not very serious real world considerations, but it should give some intuition of how much better the sunniest areas are than those just 22% less sunny. It’s obvious why this is important. For nearly 24/7 uptime loads, backups of batteries and solar overbuild are necessary. Even the sunniest place in the US requires significant amounts of this. But the sunniest place on earth basically does not have this problem. A load that needs 4kWh/m^2 of energy to fill up its batteries will hit that goal 99% of days instead of something like 70% or 50%. Many fewer solar modules are necessary to fill the batteries to get through the night. For intermittent loads, the advantage of the Atacama is only linearly better as the average irradiance increases. For high uptime loads however, there is a superlinear relationship between irradiance and energy cost, with surprisingly large differences between places with only a 22% different in average GHI. Given time, as solar/battery costs continue to fall, high uptime loads will make up the majority of SIR loads. Intermittent or high uptime, the most favorable economics are always in the Atacama.This is wildly underrated. Unit economics for industrial processes selling into a commodities market are extremely tight and competition is cutthroat. Any marginal reduction in cost means a corresponding increase in profit, which means increased IRR, higher capital efficiency, faster growth, and a higher stock price. The siren call of the Atacama grows stronger as the ratio of energy cost to transport cost favors energy in a product’s unit economics.Additionally, for each new SIR technology, economic breakeven always happens first in the Atacama.As solar and batteries come down the cost curve, new processes will continuously become profitable. Being a first mover matters a lot in business; there are huge gains to being the first to commercialize a process. A staggering number of the largest industrial companies today were simply the first to do a thing in their region. It’s not unreasonable to think that all of tomorrows solar industrial giants will first commercialize their tech in the Atacama. The idea that a single geographic location being somehow much better than anywhere else is very exciting. Definitional cornered resource. There’s way more alpha and potential for profit if geographic exceptionalism turns out to be true for solar economics.


For either intermittent or high uptime applications, the most favorable economics are always in the Atacama.Profit maximizing companies will line up at the door once they realize this.
Additionally, for each new SIR technology, economic breakeven always happens first in the Atacama. There will be a concentration of new technologies at this desert.
UPDATE: I BUILT AN INTERACTIVE MODEL OF SOLAR MICROGRID COSTS CHECK IT OUT
The cost of installed solar is significantly higher than the cost of modules.
You need more than just a solar module to make useful power. That means engineering work, material transport, civil site prep, install labor, structural and electrical balance of system, and inverters.
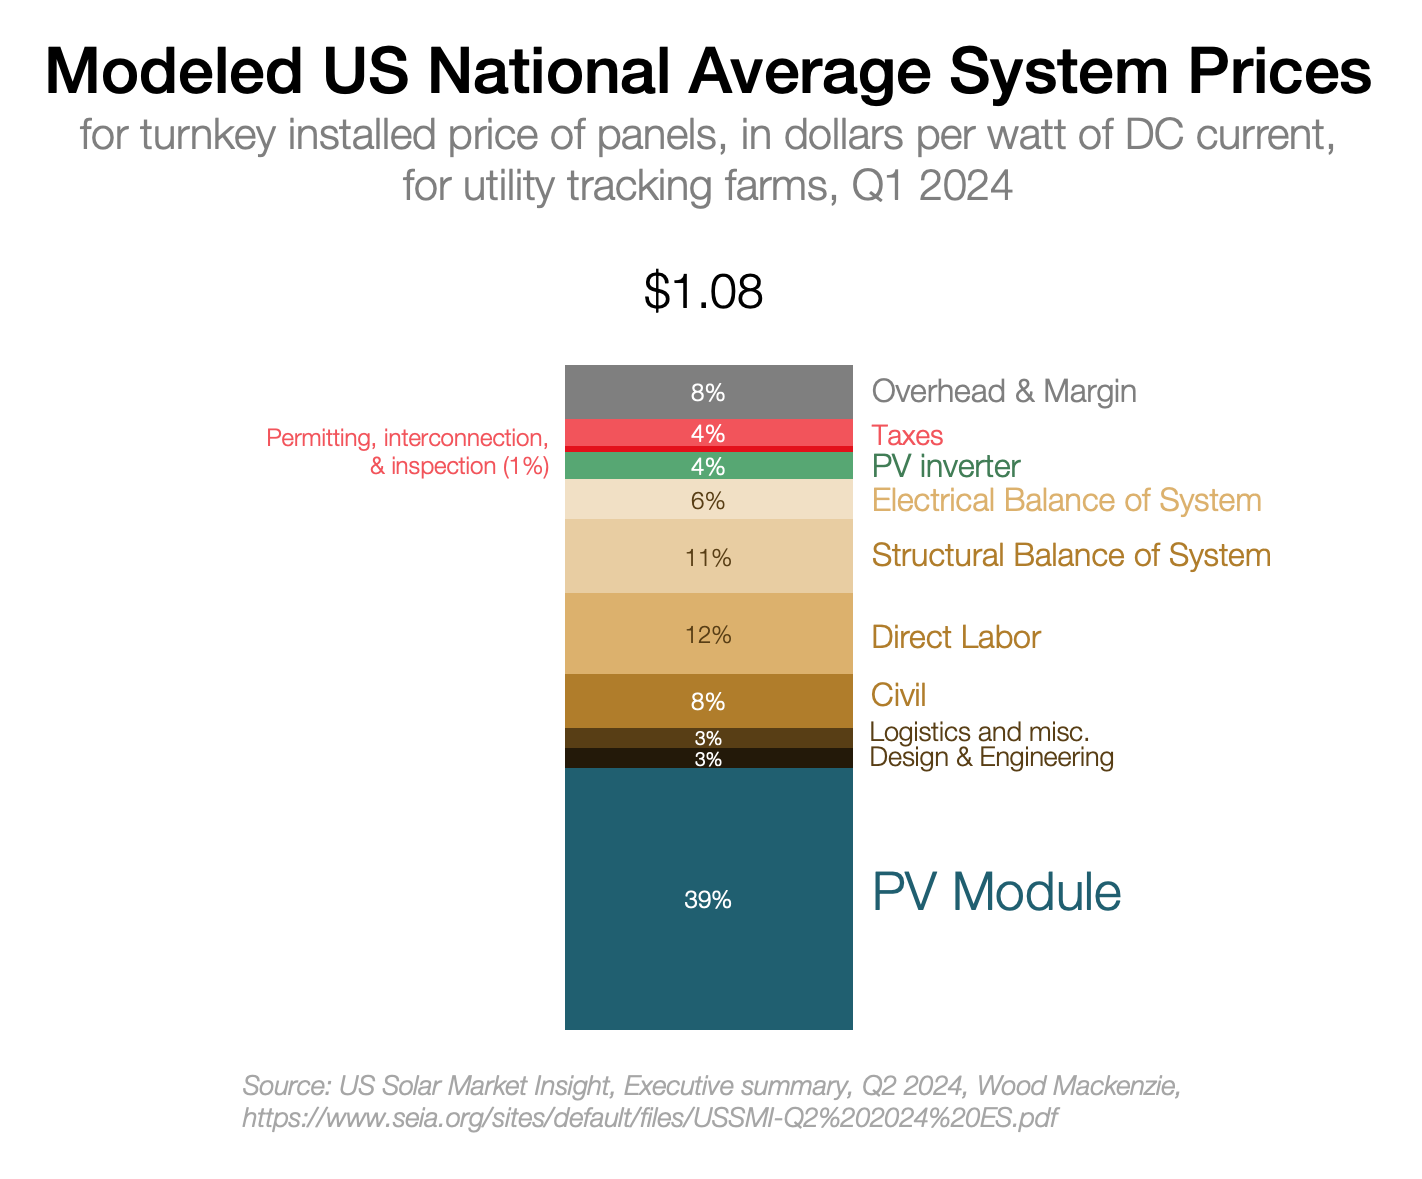
All of these make the cost of useful solar energy 2-4x more expensive than the base modules. If solar modules were free and deleted from the receipt, solar energy wouldn’t even be half as expensive as it is now. All the module learning curves in the world won’t help solar deployment grow if the rest of the costs don’t deflate in lockstep with the modules.
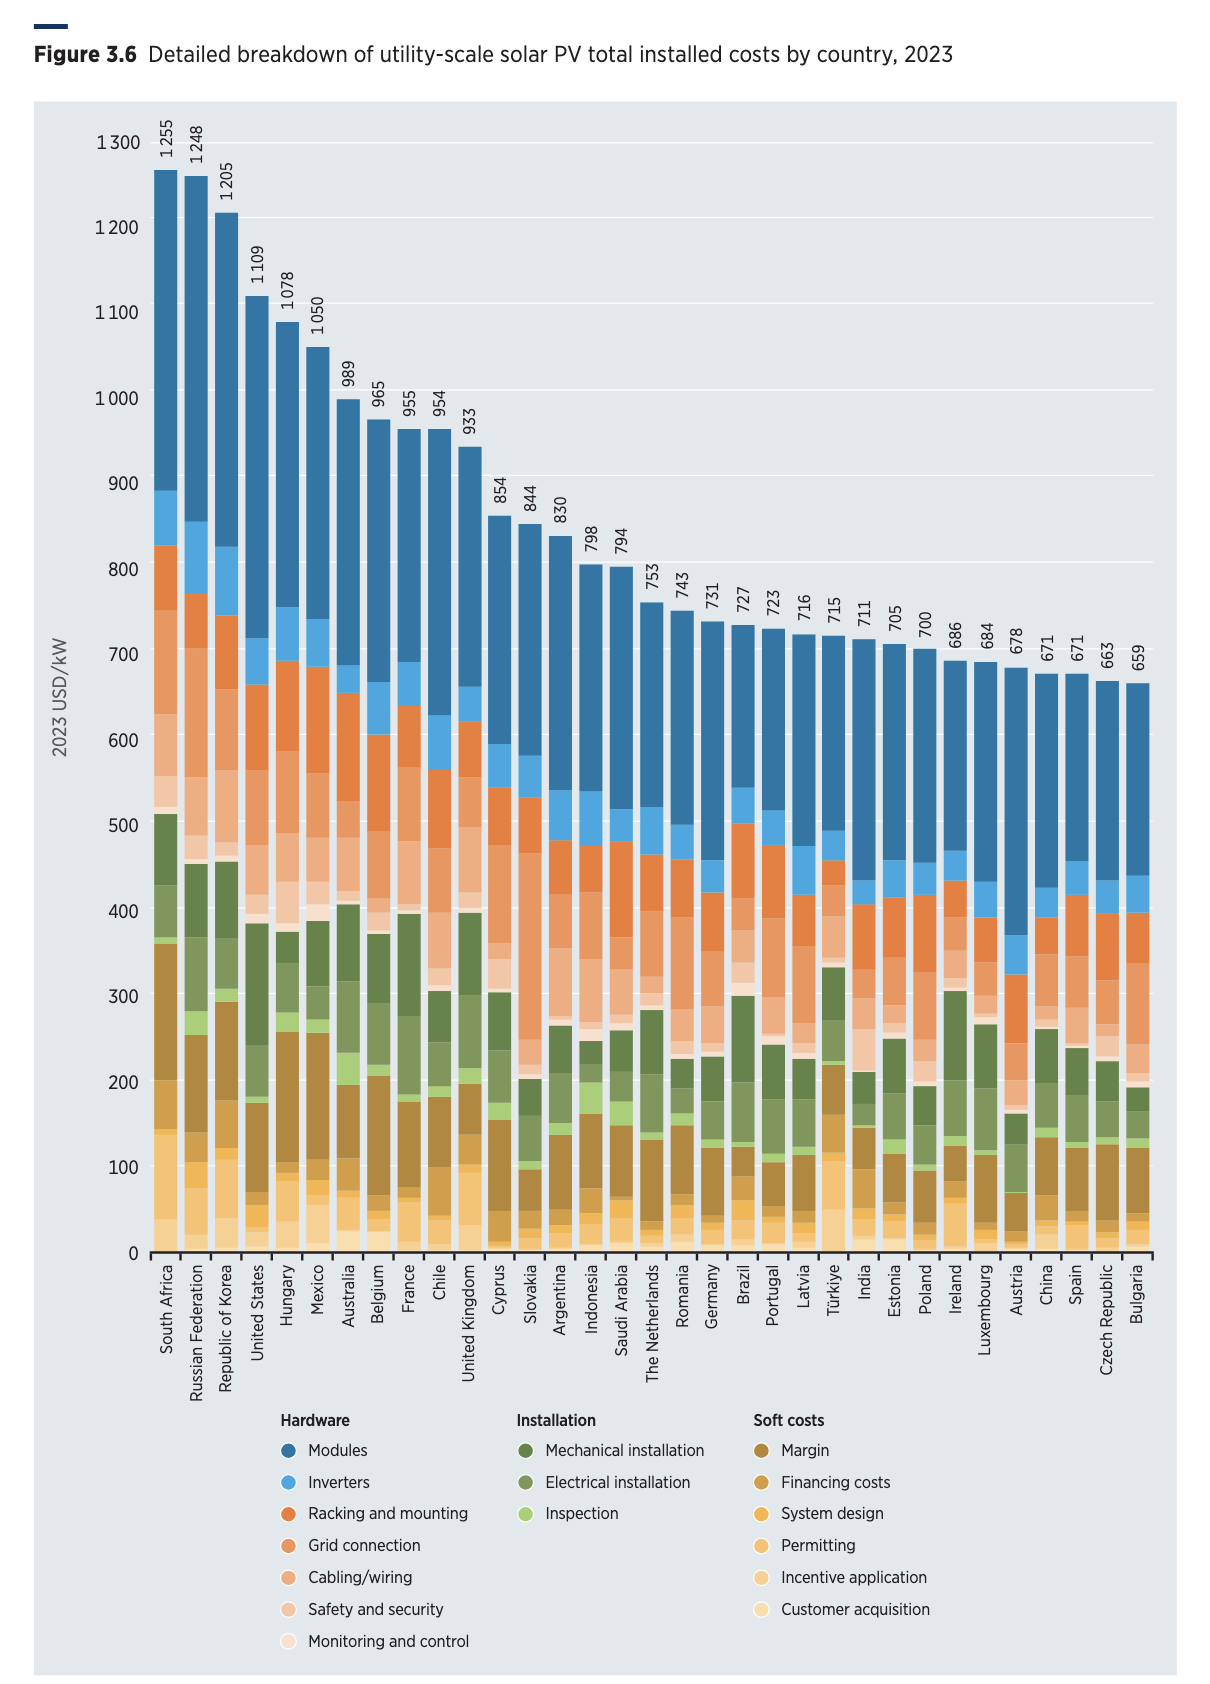
The narrative generally portrayed is that solar modules used to be almost all of the cost of a solar installation and recently they’ve dropped low enough for the non-solar components to now make up the majority of the cost. This story is worrying; we have no idea if non-solar components are able to deflate. Thankfully, it doesn’t appear to be true. Across different locations, times and module prices, the solar modules have over the last 15 years stayed between 25% and 50% of the total cost of an array. In higher soft cost countries like the US, modules make up a smaller percentage of the installed cost, and somewhere like India they take up a higher percentage.
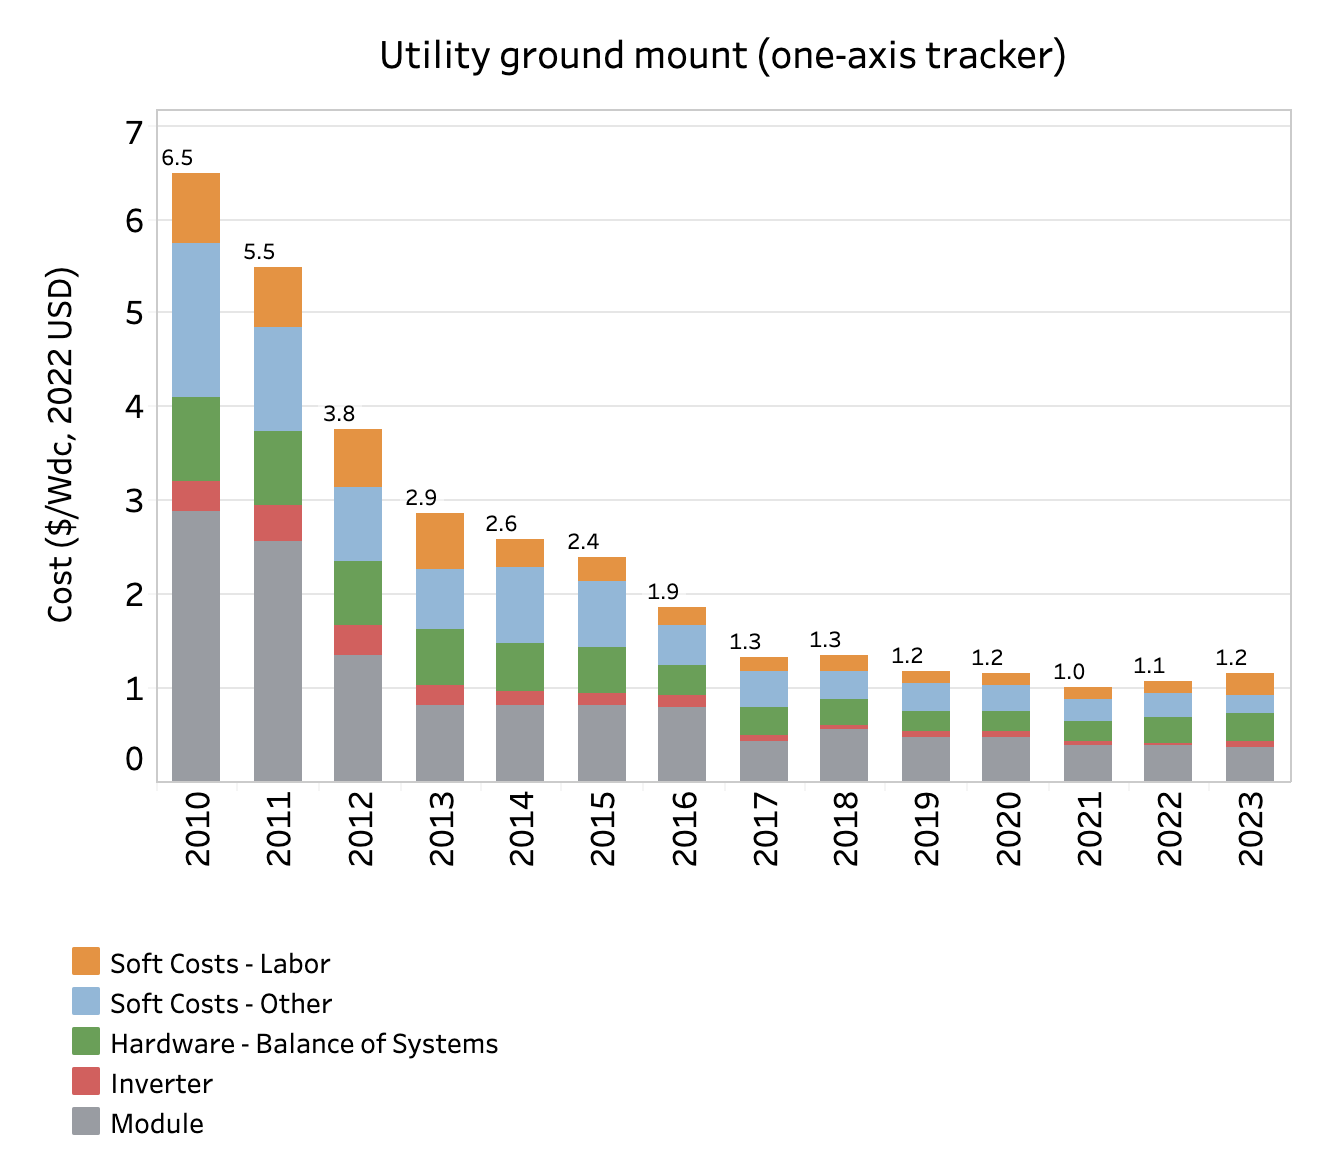
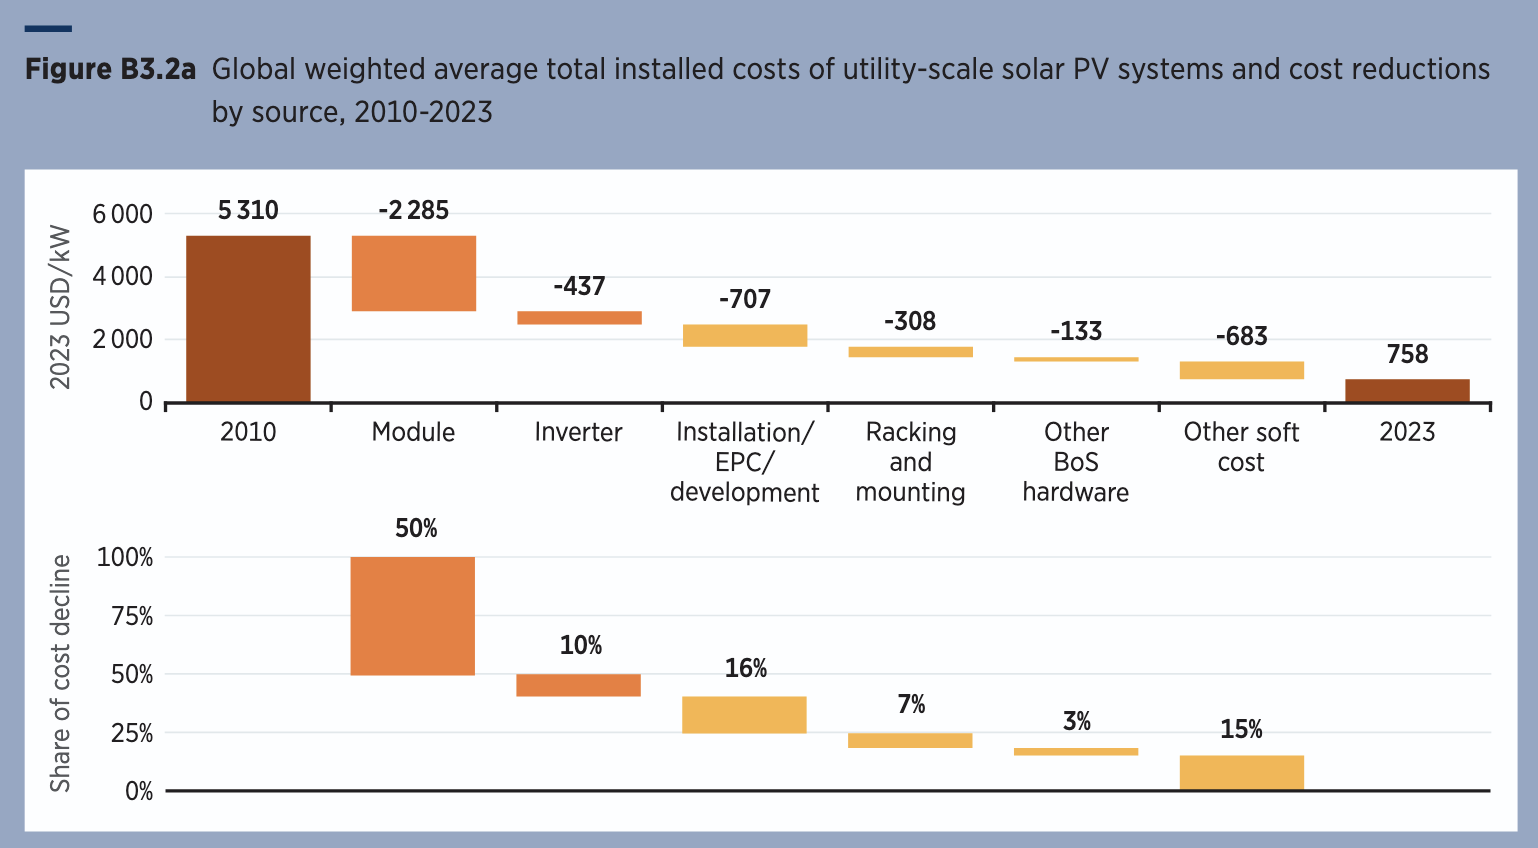
While modules have driven a majority of the cost declines, other sources have deflated roughly proportionally. It looks like the other components of cost are able to fall in line with solar modules, keeping the module between 25% and 50% of the installed cost.
There’s no guarantees that this will continue however. Were the non-module improvements just low hanging fruit? While modules themselves are driven by experience curves and as noted before appear to have a very low floor, the same is not necessarily true of steel tubing or labor or pile drivers.
Components like inverters will see cost declines, because the solar industry drives enough scale to create their own experience curves. But 100x-ing solar wouldn’t make a dent in global steel production, so we can expect to see minimal cost declines there.
Progress will have to come down to human ingenuity. The most obvious example is in how we arrange a solar array.
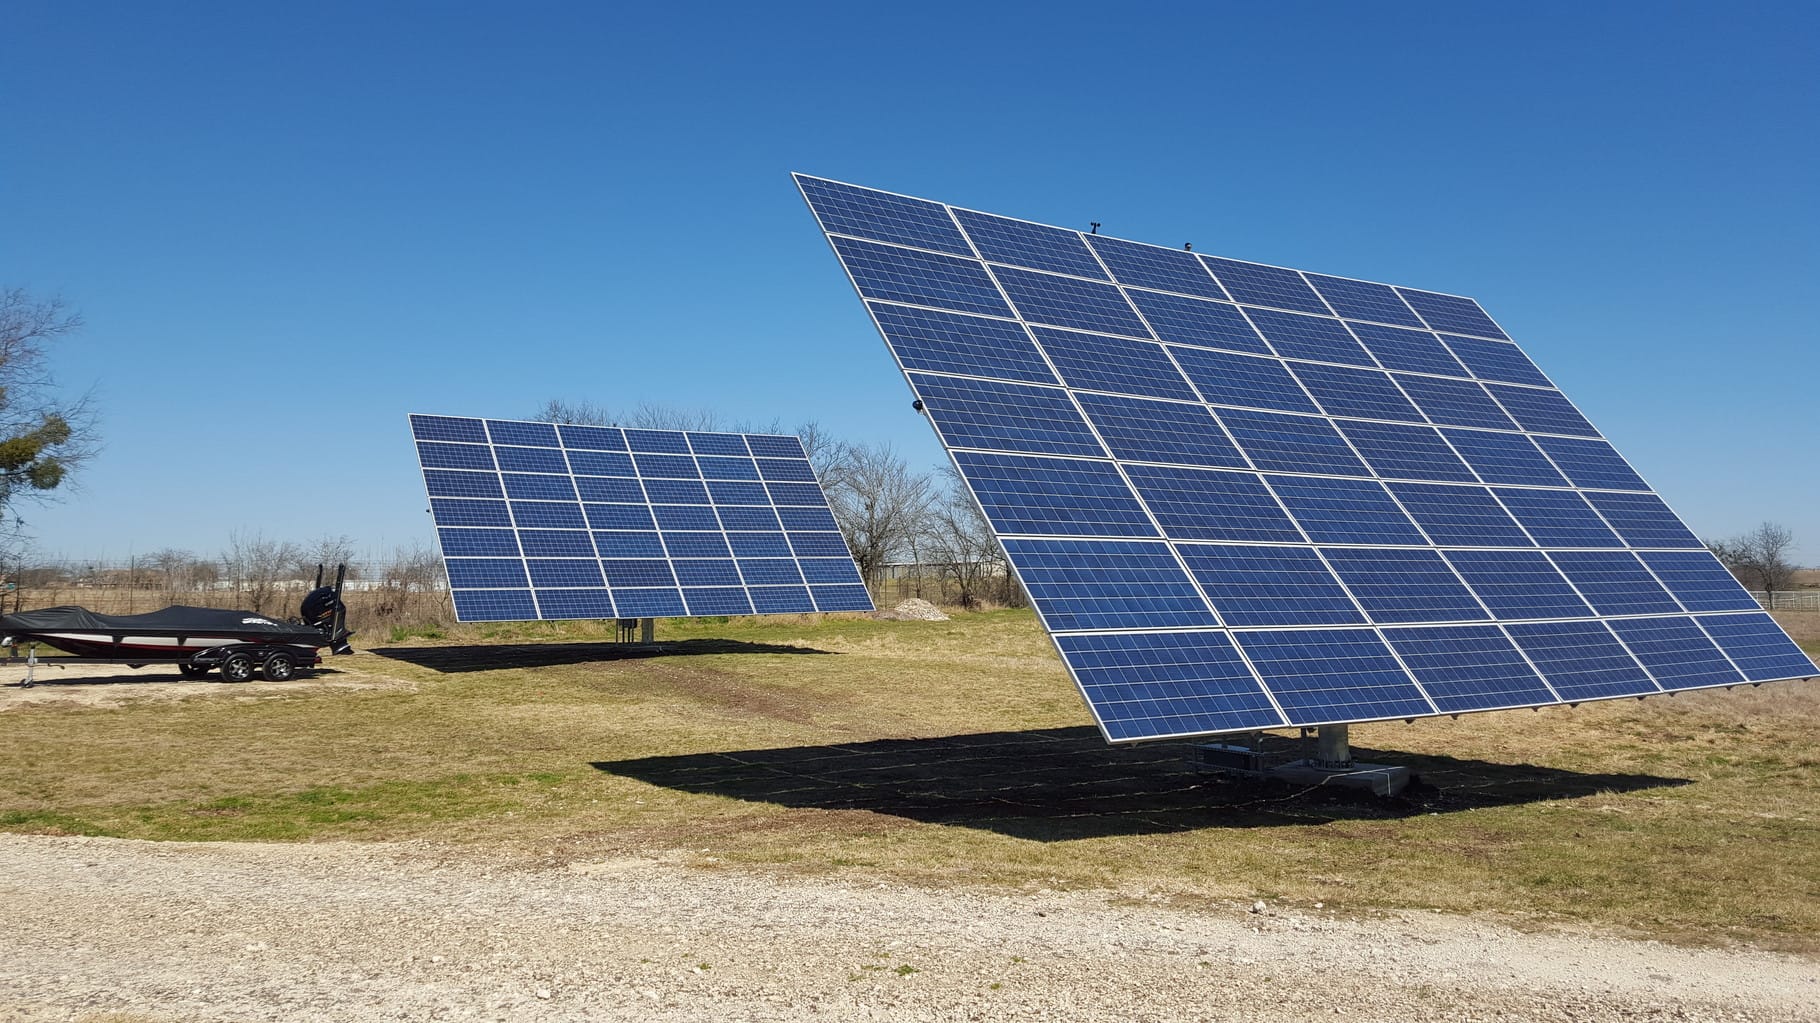
Just 10 years ago, the cost of a solar module was $1/W. The entire installed cost of today’s solar arrays cost as much per watt as just the modules did a decade ago. When solar panels were expensive, we had to get as much energy out of each of them as possible, starting with dual axis trackers, then single axis, then fixed tilt, and now east-west arrays look to become dominant.
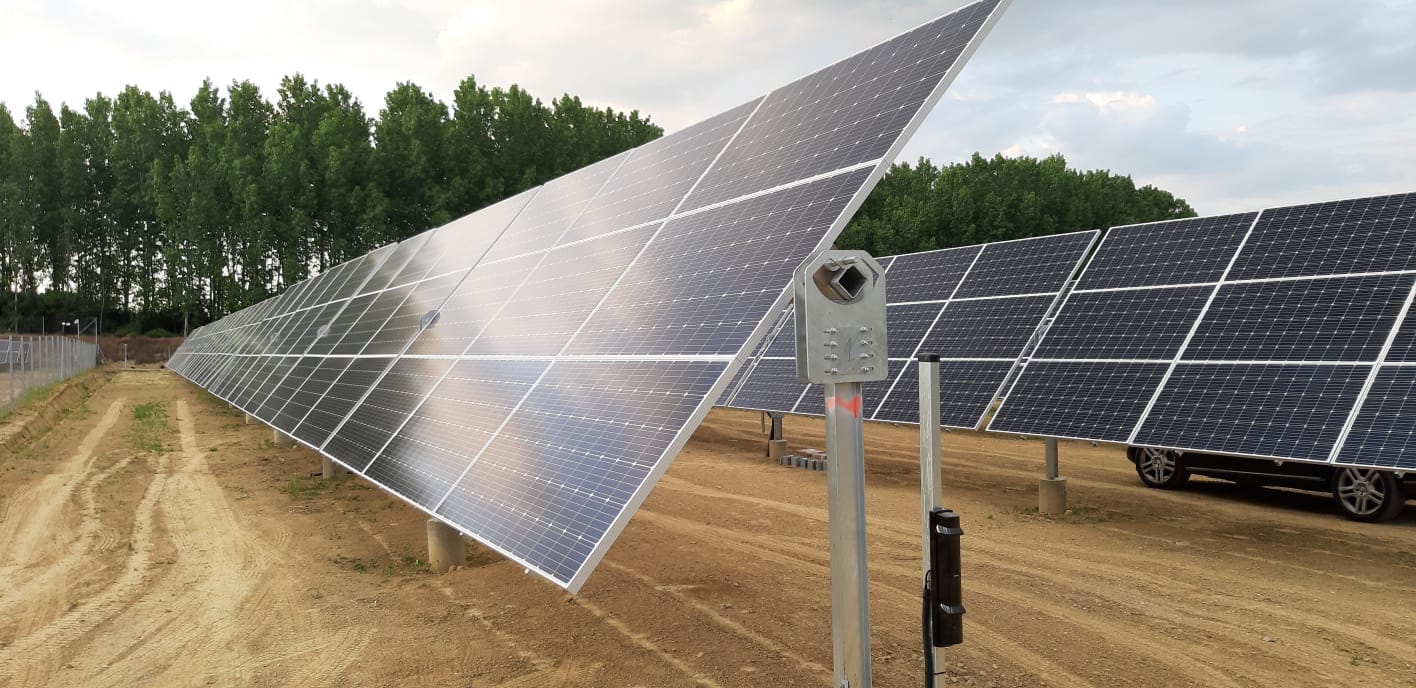
Each step along the line reduces structural capex and decreases energy per panel as panels become a smaller portion of the total cost of an array. It’s all a big series of tradeoffs.
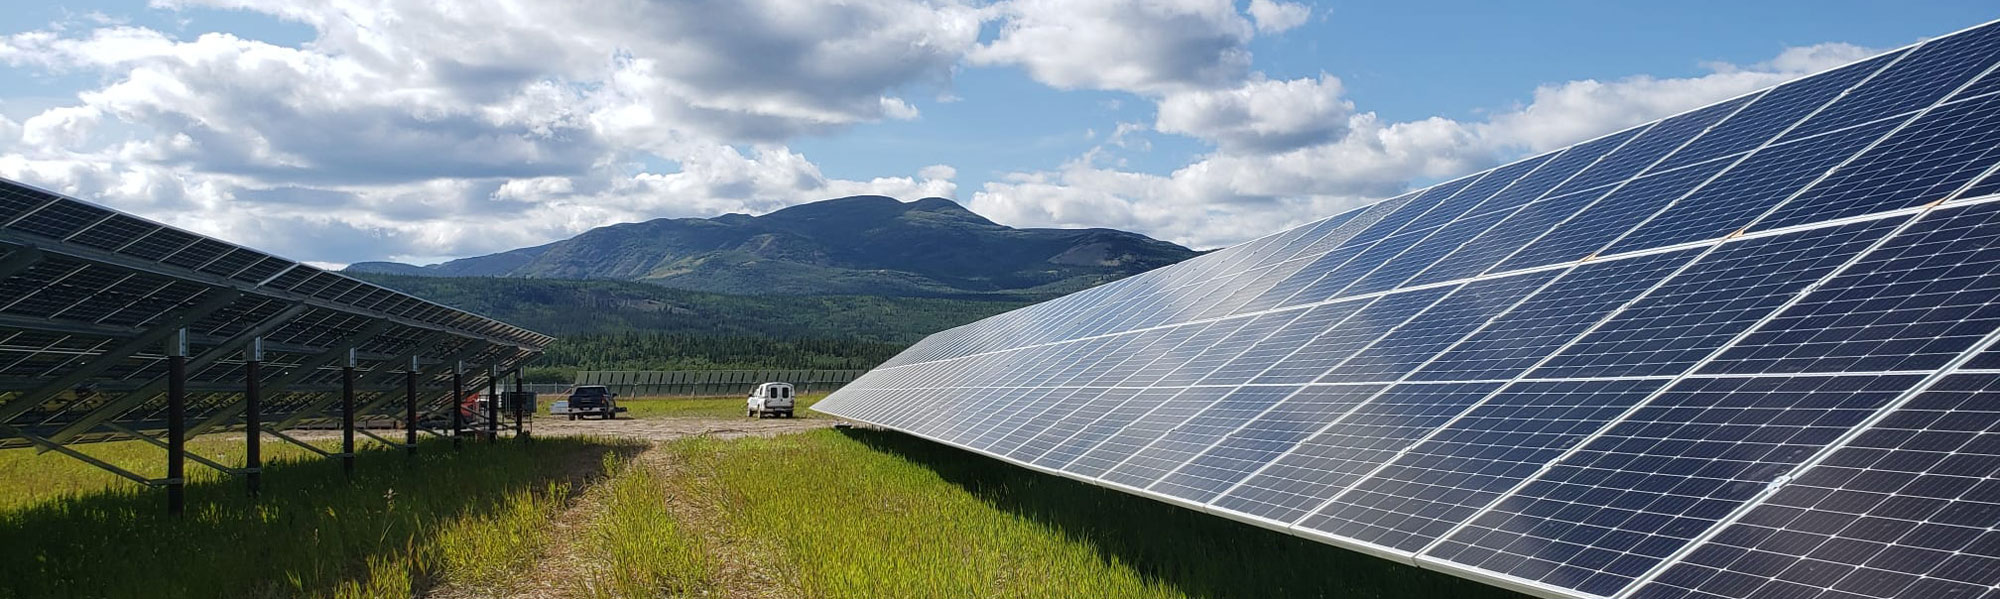
We may eventually just drop panels directly onto the ground, though the flooding and thermal challenges of this remain to be solved.
Other costs have solutions. As soft costs make up a larger portion of the cost, energy users can go off grid to reduce them. As labor costs go up, install will get increasingly automated. As land costs go up, the panels will get packed closer together. It will take the full force of a competitive capitalist economy to arrive at the optimal solution as module prices fall. It’s all an asymptote to laying modules on the ground and they spit off electricity.
America is really not great at solar (Or, China is unbelievably good at solar)
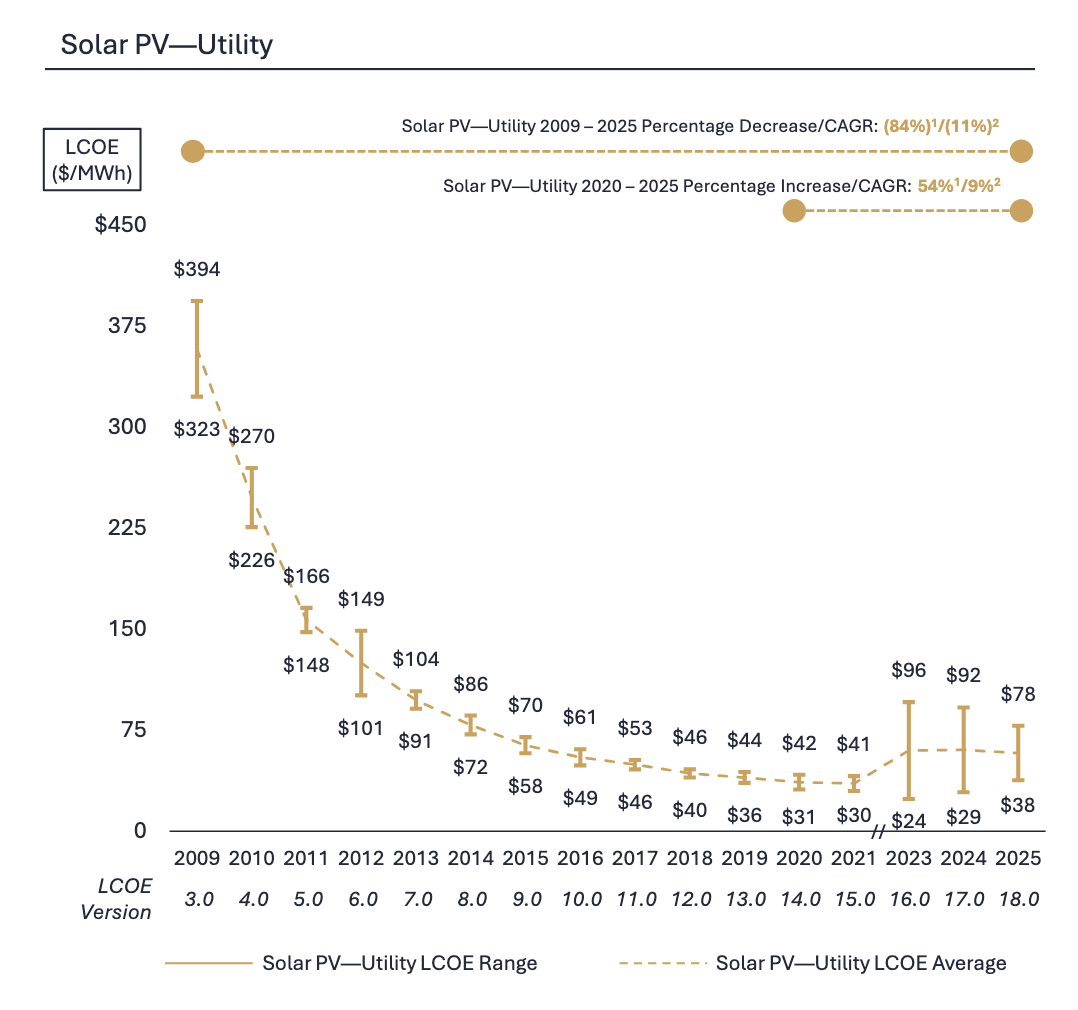
In the face of worldwide LCOE cost declines, America has seen its LCOE increase by 54% since 2020
Only 4 major countries have more expensive solar than America. Why?
- US modules are uniquely more expensiveThe US has protectionist tariffs against Chinese solar panels as well as Chinese producers’ panels from other countries, particularly Southeast Asia. Here’s a history of US solar tariffsWhile Chinese (and world) solar modules are as low as 8c/W, US market rate modules are around 30c/W.
- The US’s utterly bizarre tax credit financing system incentivizes companies to inflate the cost of projects to get the maximum government subsidy that they can distribute to the financial institutions that back them. My understanding is this system recently has been greatly simplified and there is now a liquid market for tax credits.
- Interest rates rose, making debt for financing a 25 year payback solar array more expensive than the ZIRP era.
- As solar got cheap, there was a rush of developers trying to install it on the grid, which pushed up permitting costs, interconnection costs, introduced delays, and other soft costs.
- Inflation in materials and labor
Now, you have to give America some credit. In our own silly stupid way, we are the only economy²¹ not succumbing to the Chinese industrial steamroller and are actually attempting to produce an entire domestic solar supply chain. Only in ingot and wafer production is America significantly falling short of fulfilling domestic demand. While in the short term that means prices are multiples higher than those seen in China, this will be essential to national security in the long term. Solar production is extremely automated; the only reason China’s supply chain is more efficient than the US’s is its massive economies of scale and industrial agglomerations. In principle, nothing is stopping the US from getting within striking distance of Chinese costs.
But right now, US domestic modules are $0.30-$0.60/W to China’s $0.08/W. This is pretty much entirely due to the scale China operates at.
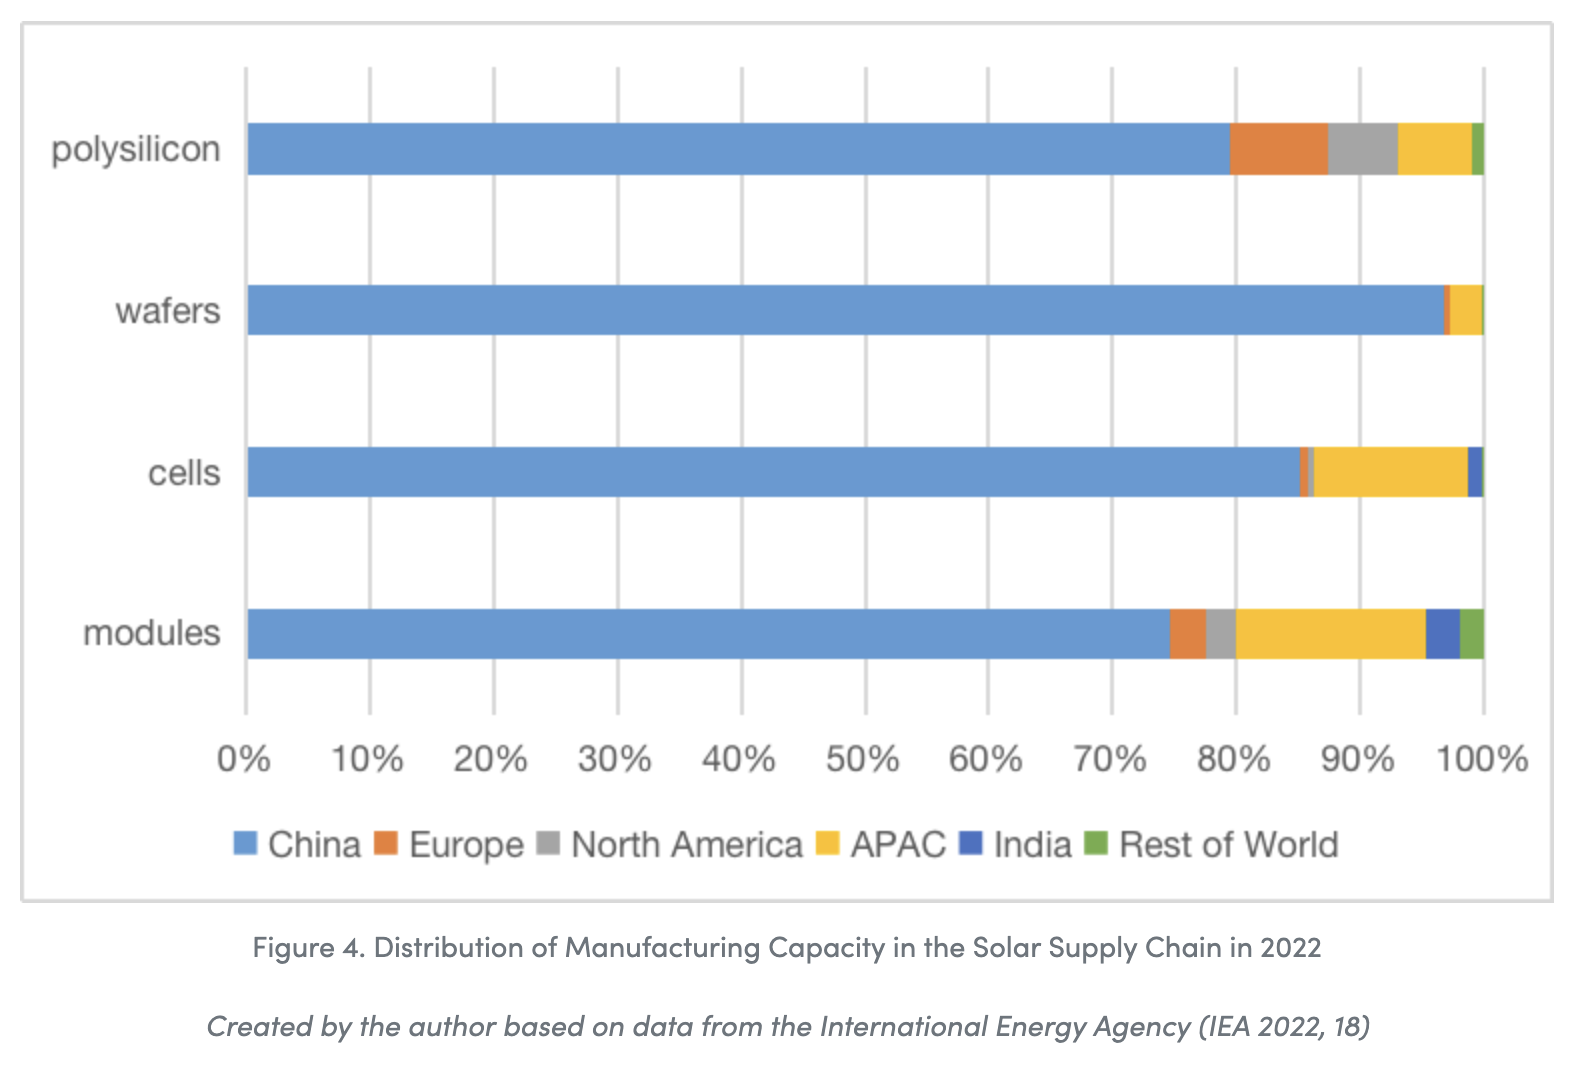
China’s dominance in solar production is staggering. Furthermore, nearly all APAC production is just subsidiaries of Chinese firms to skirt tariffs. The rest of the world is a rounding error. The miracle cost declines of the last 15 years are just a function of Chinese industrial prowess.
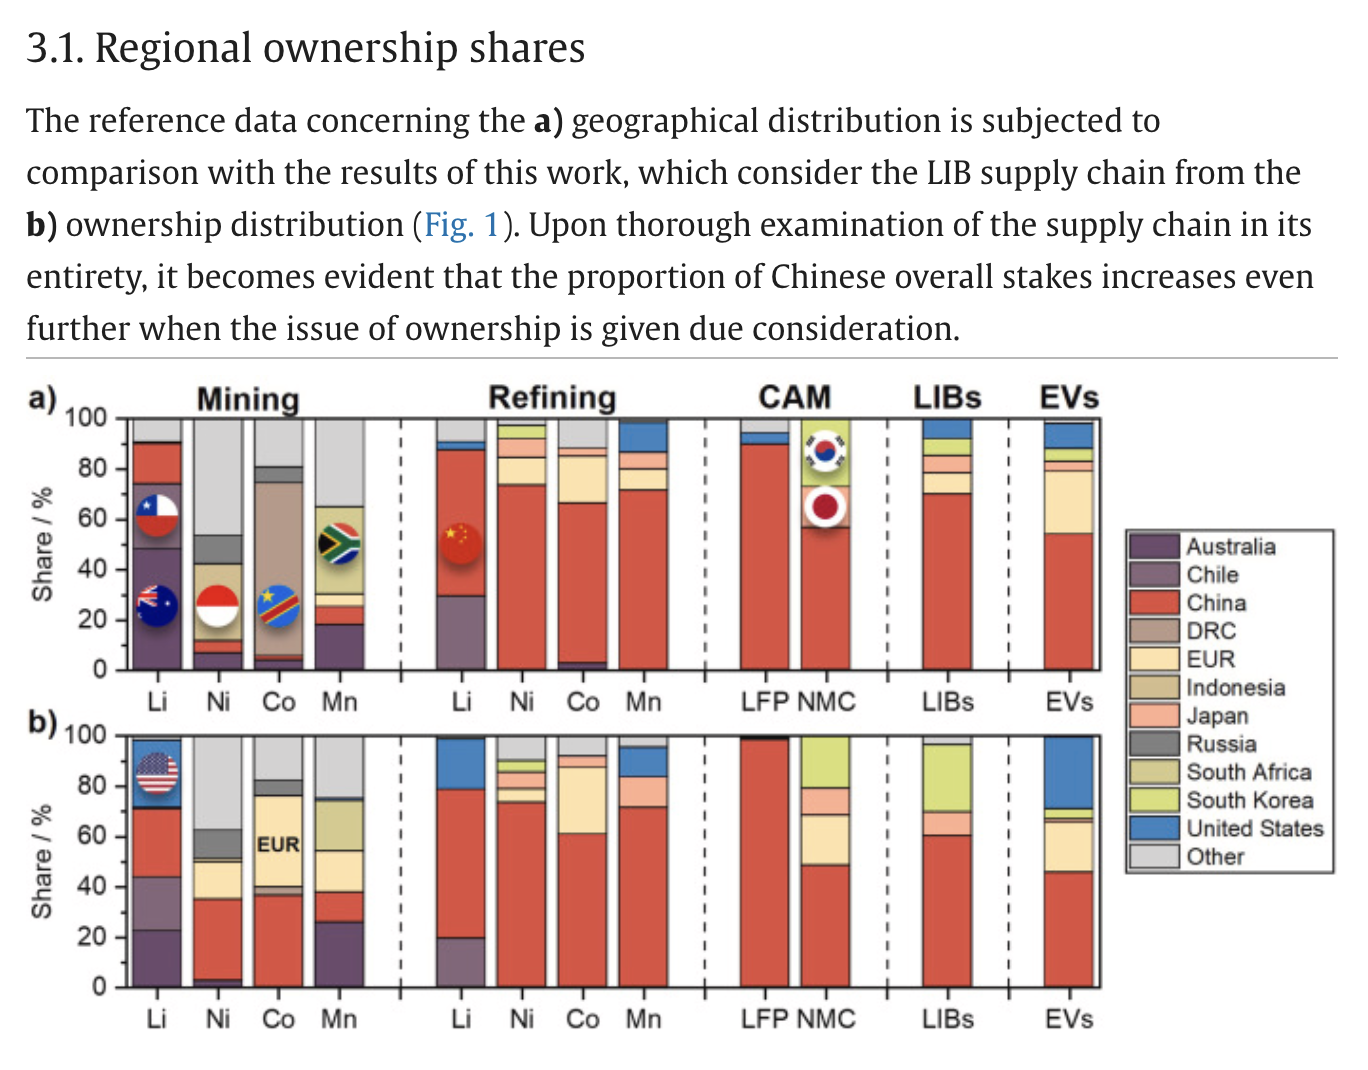
China also dominates the battery supply chain.
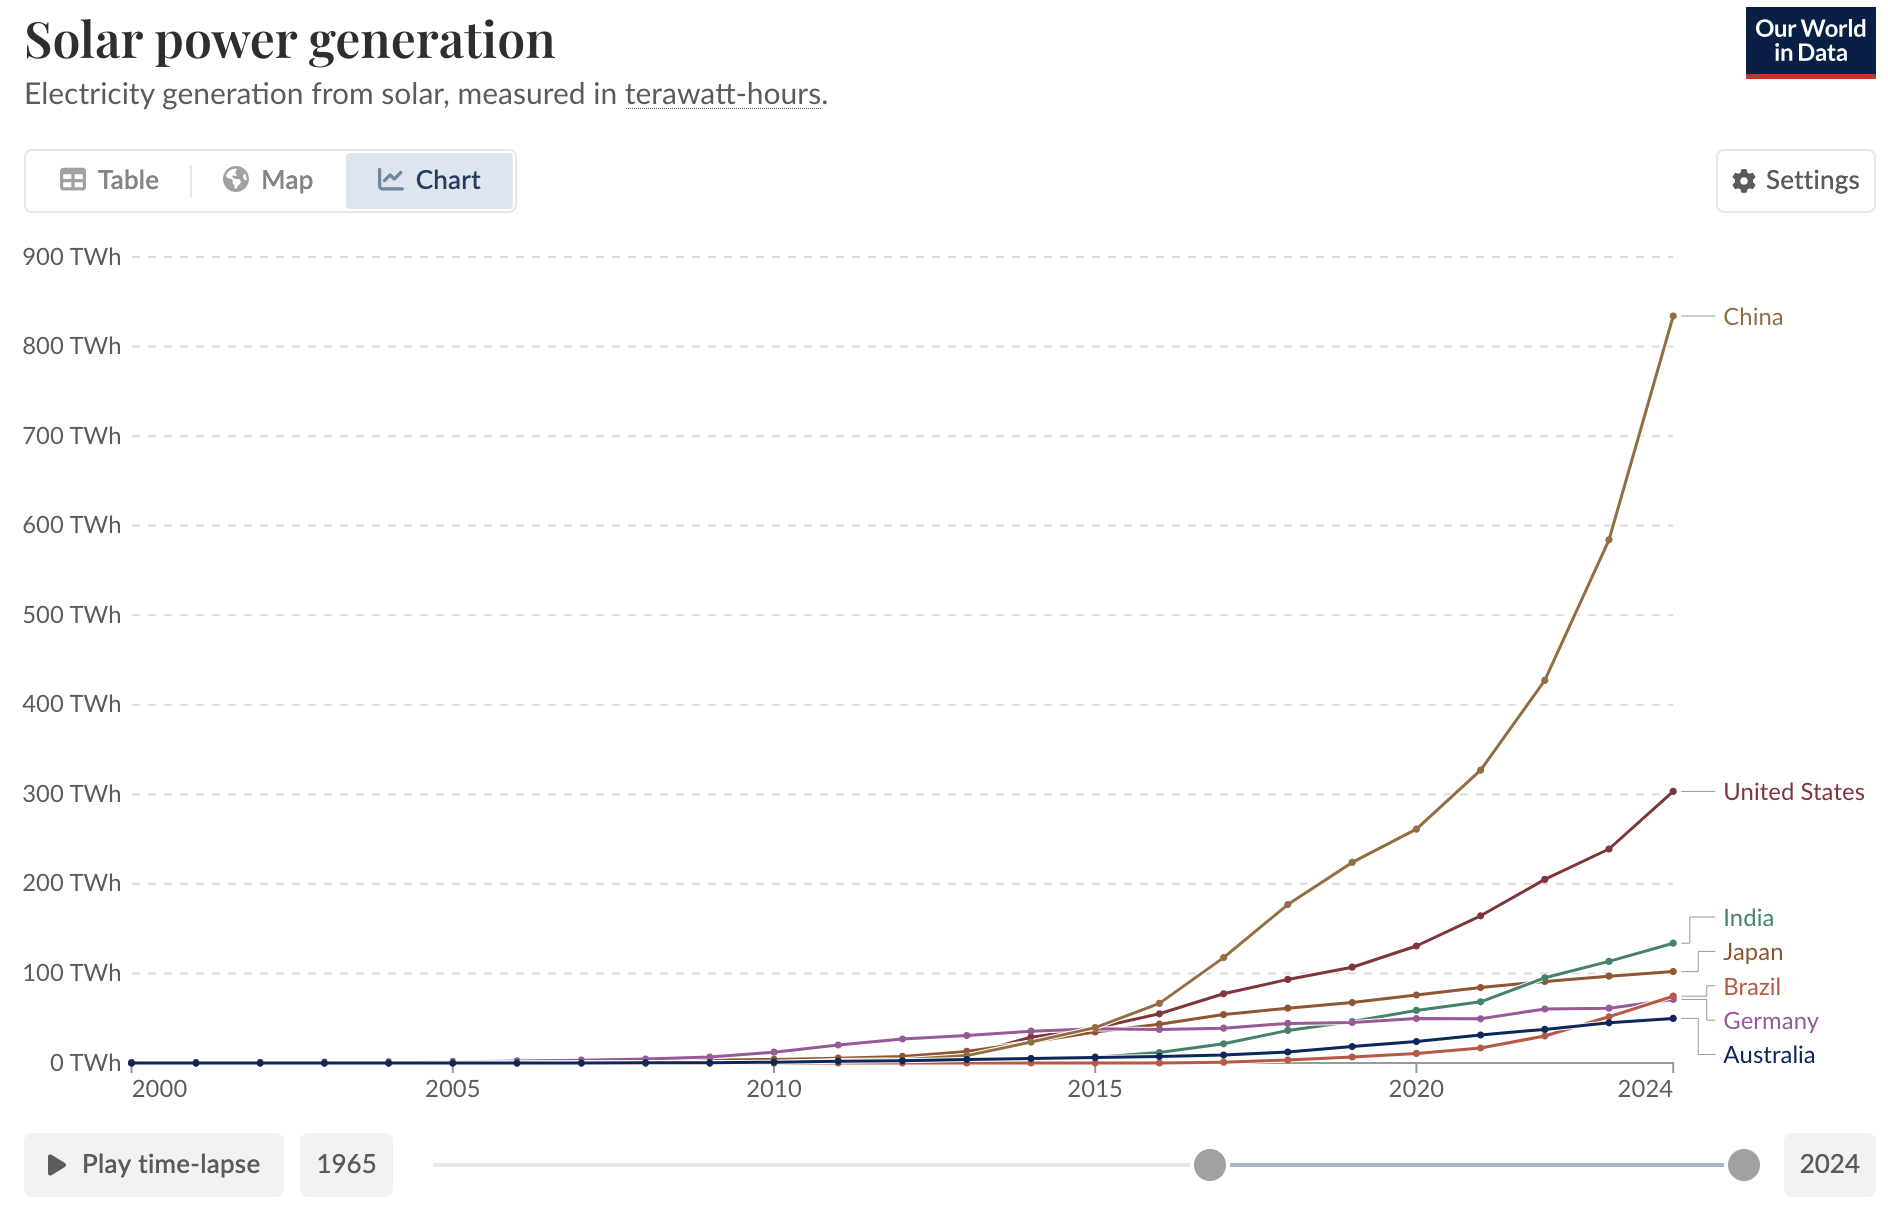
They’re not just exporting the modules either, they’re out installing every other country by a huge margin. China is not doing this because they care about climate change. They know that solar combined with batteries is the energy source that will power the next century; it is simply the cheapest and can be installed at immense scale.
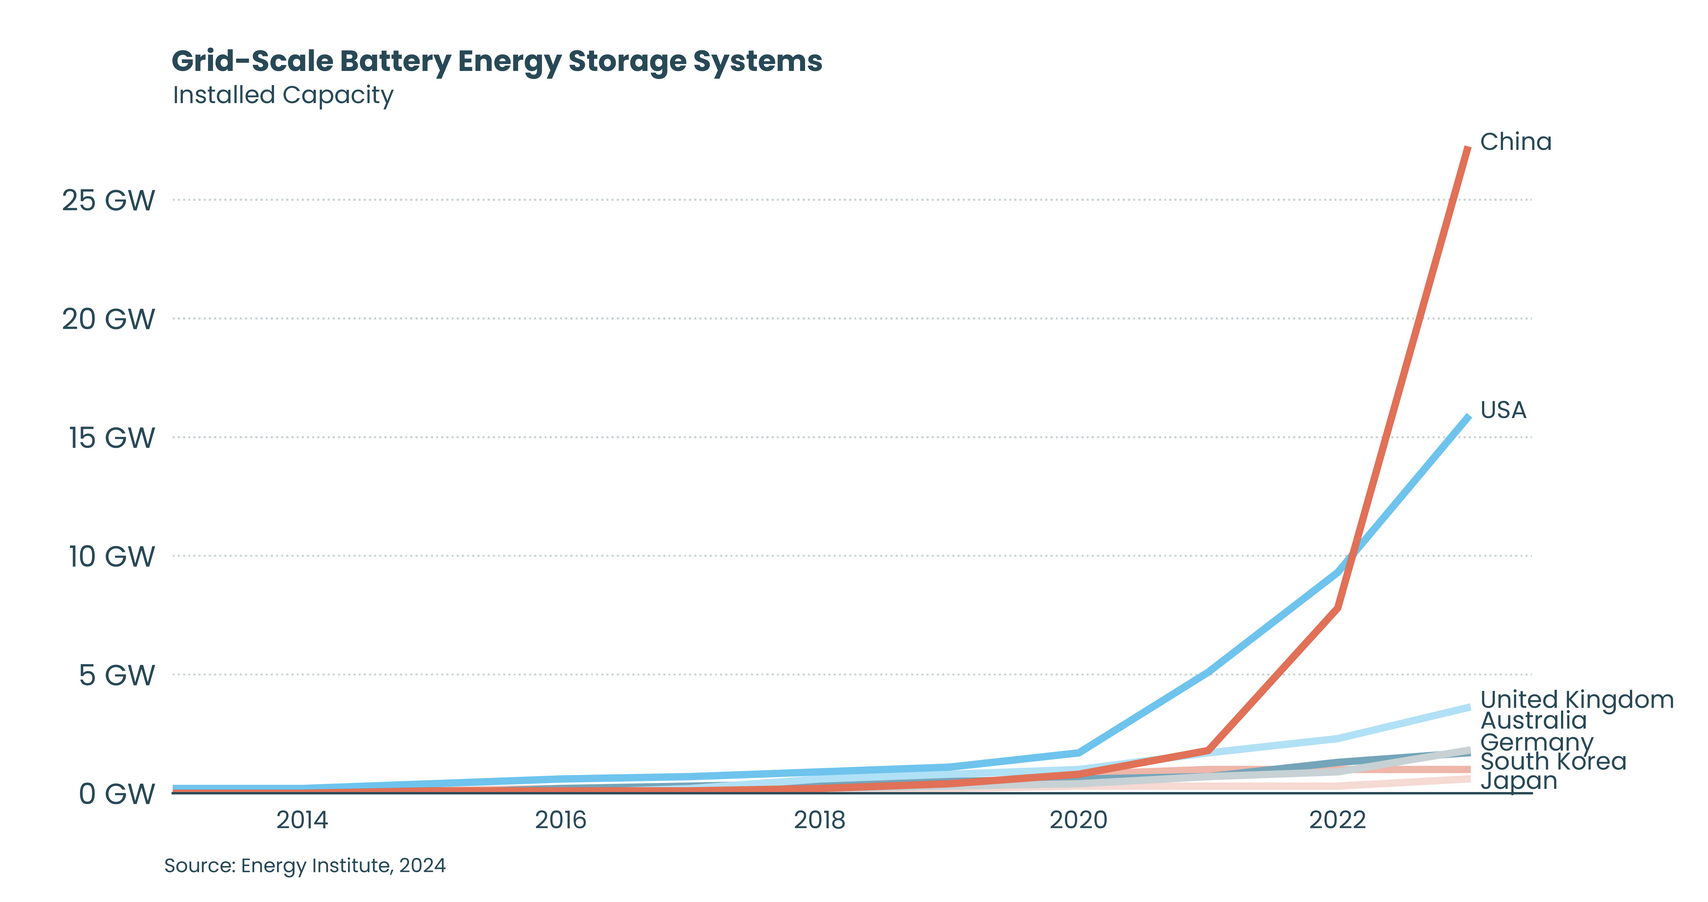
China has recently surpassed the US in battery storage as well.
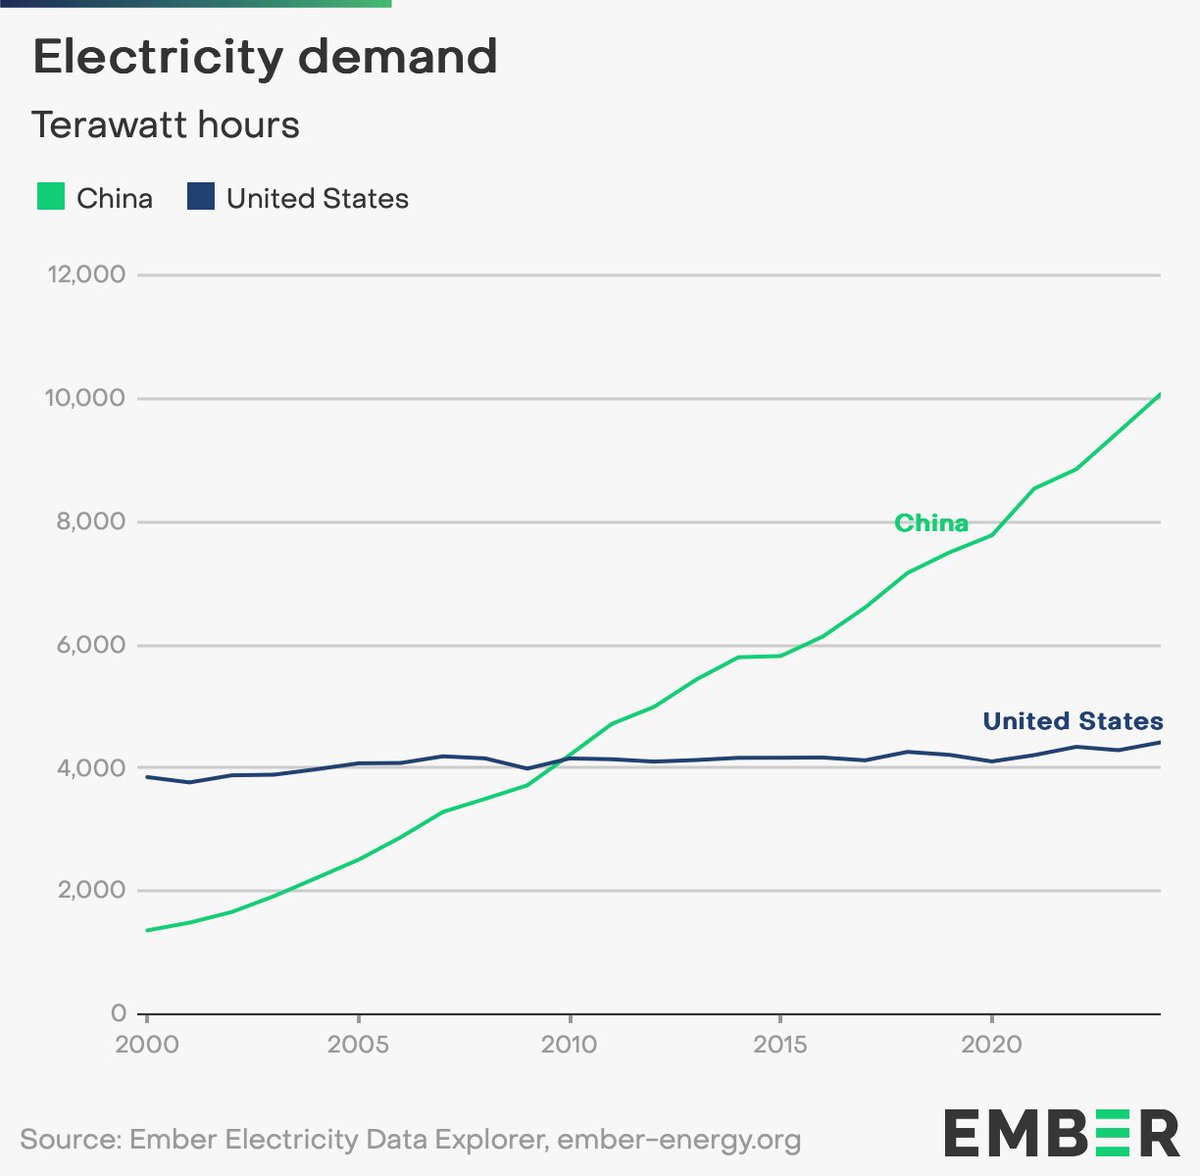
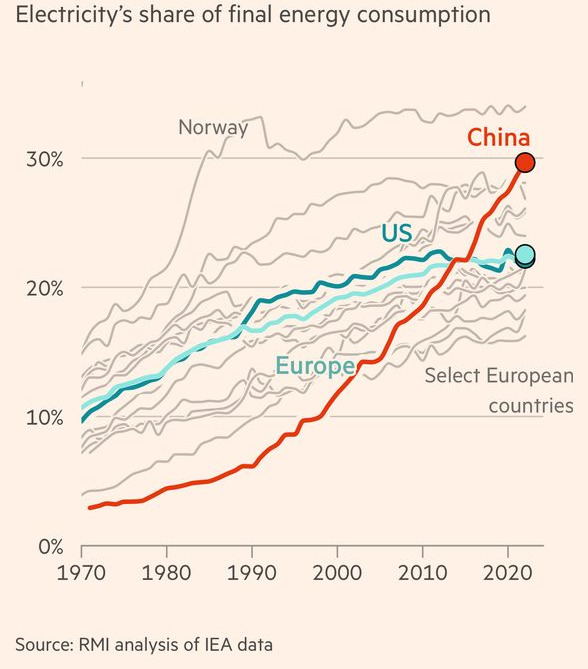
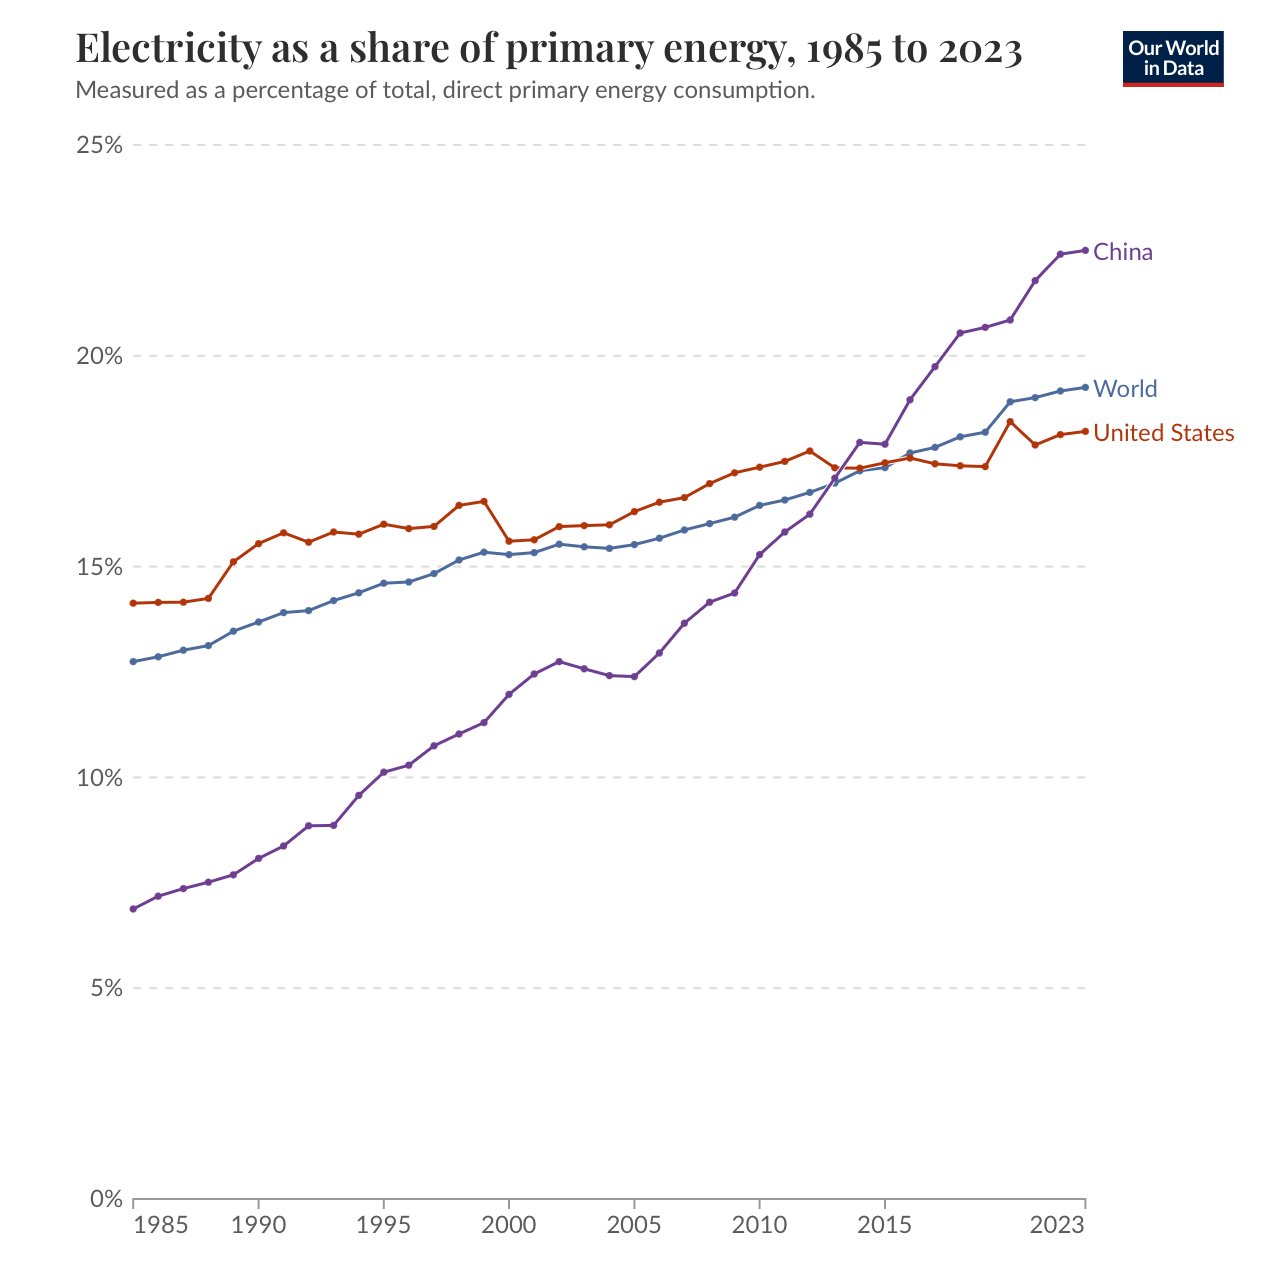
There is related phenomenon in which China (and Southeast Asia generally) is trouncing the rest of the world: electrification. While the western world thinks of the electricity as an old invention, with the system built out, it makes up a relatively small share of energy consumption, only 20% or so. The remainder is in the form of chemical thermal combustion. China believes that this electric share can go much higher, approaching 100% and are building out their infrastructure accordingly.
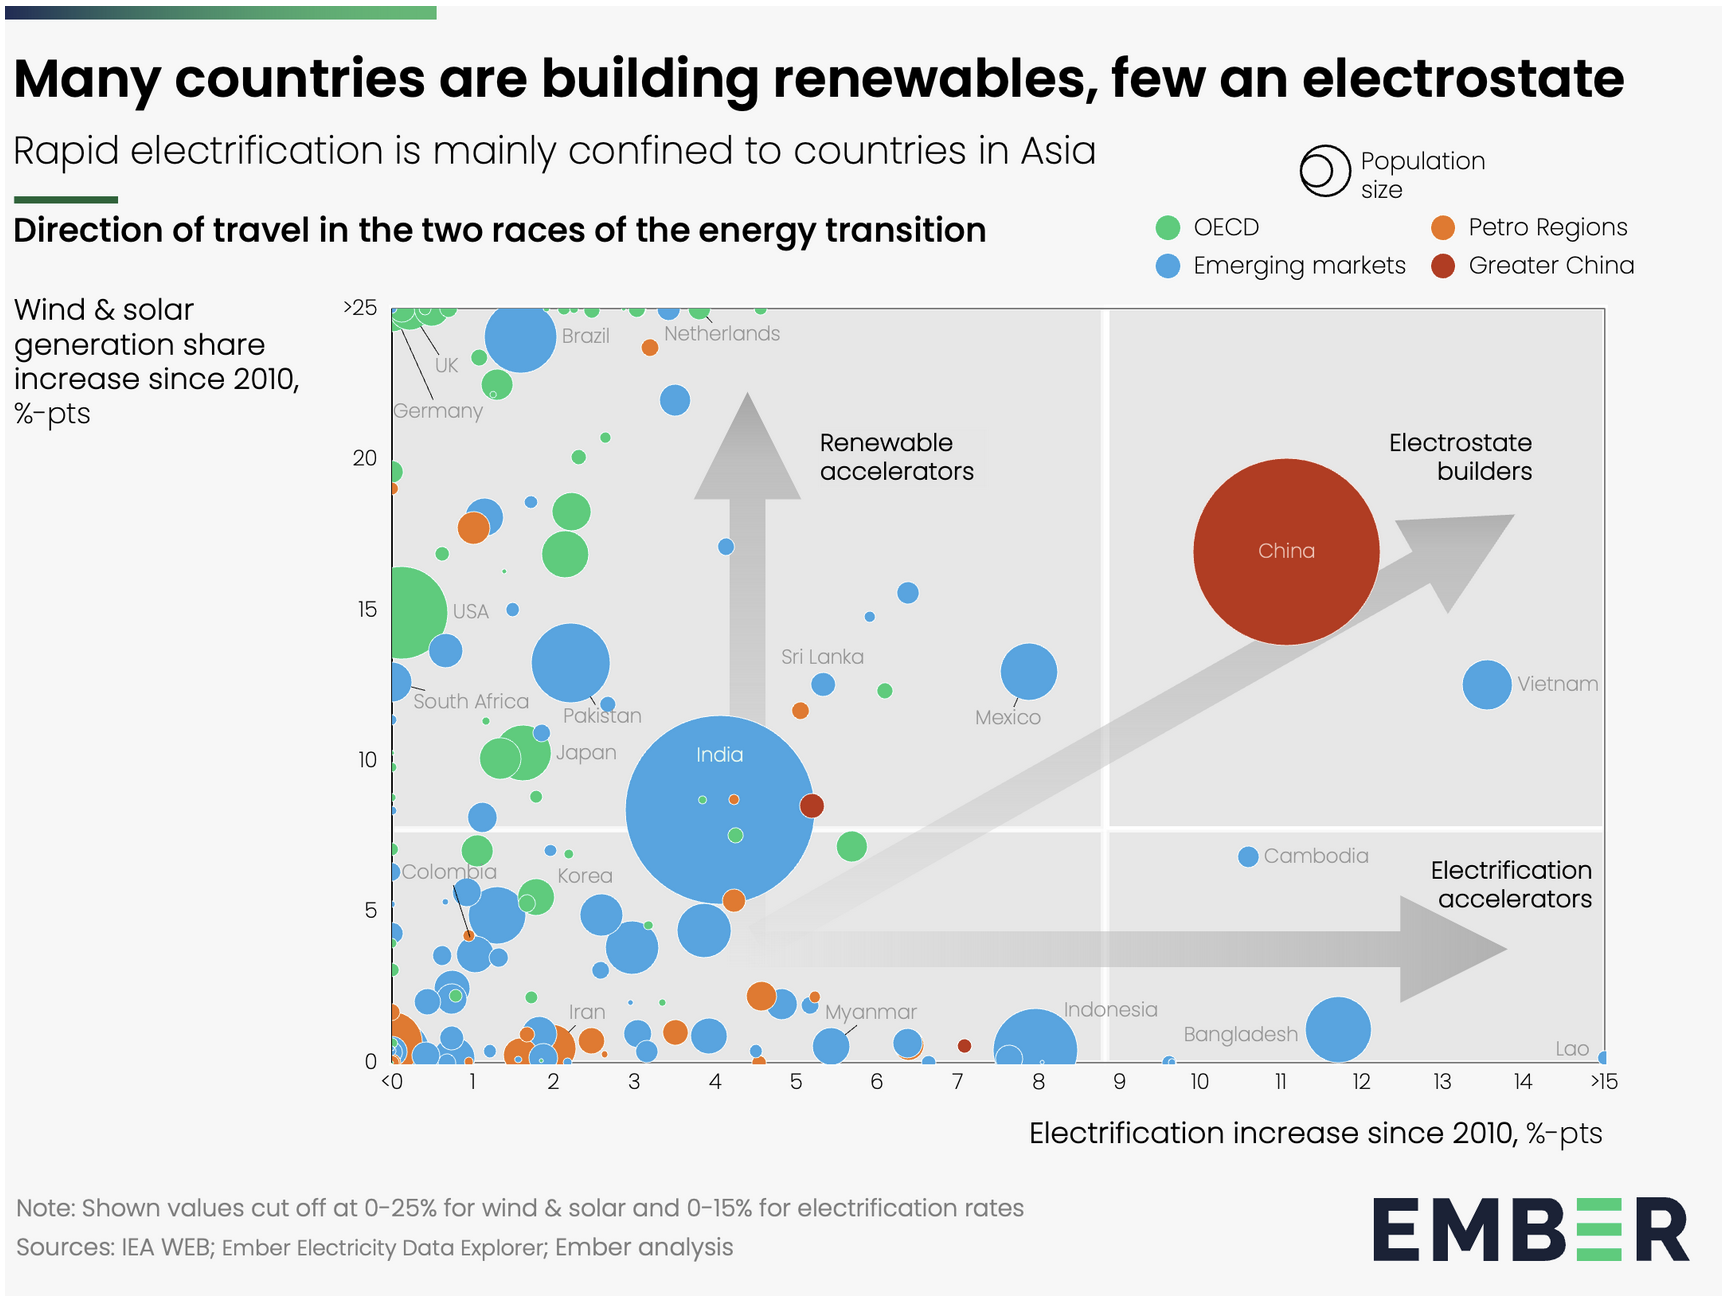
This means fewer natural gas lines and more heat pumps, fewer ICE cars and more EVS, fewer diesel locomotives and more electric trains, fewer coke blast furnaces and more arc furnaces, fewer heat engines and more motors, fewer thermal and more electrochemical pathways in industry.
I don’t know about you but I don’t like this at all. America is a rounding error in the energy source of the future. Remember WW2? Want to reason by analogy? We are not America in this analogy!
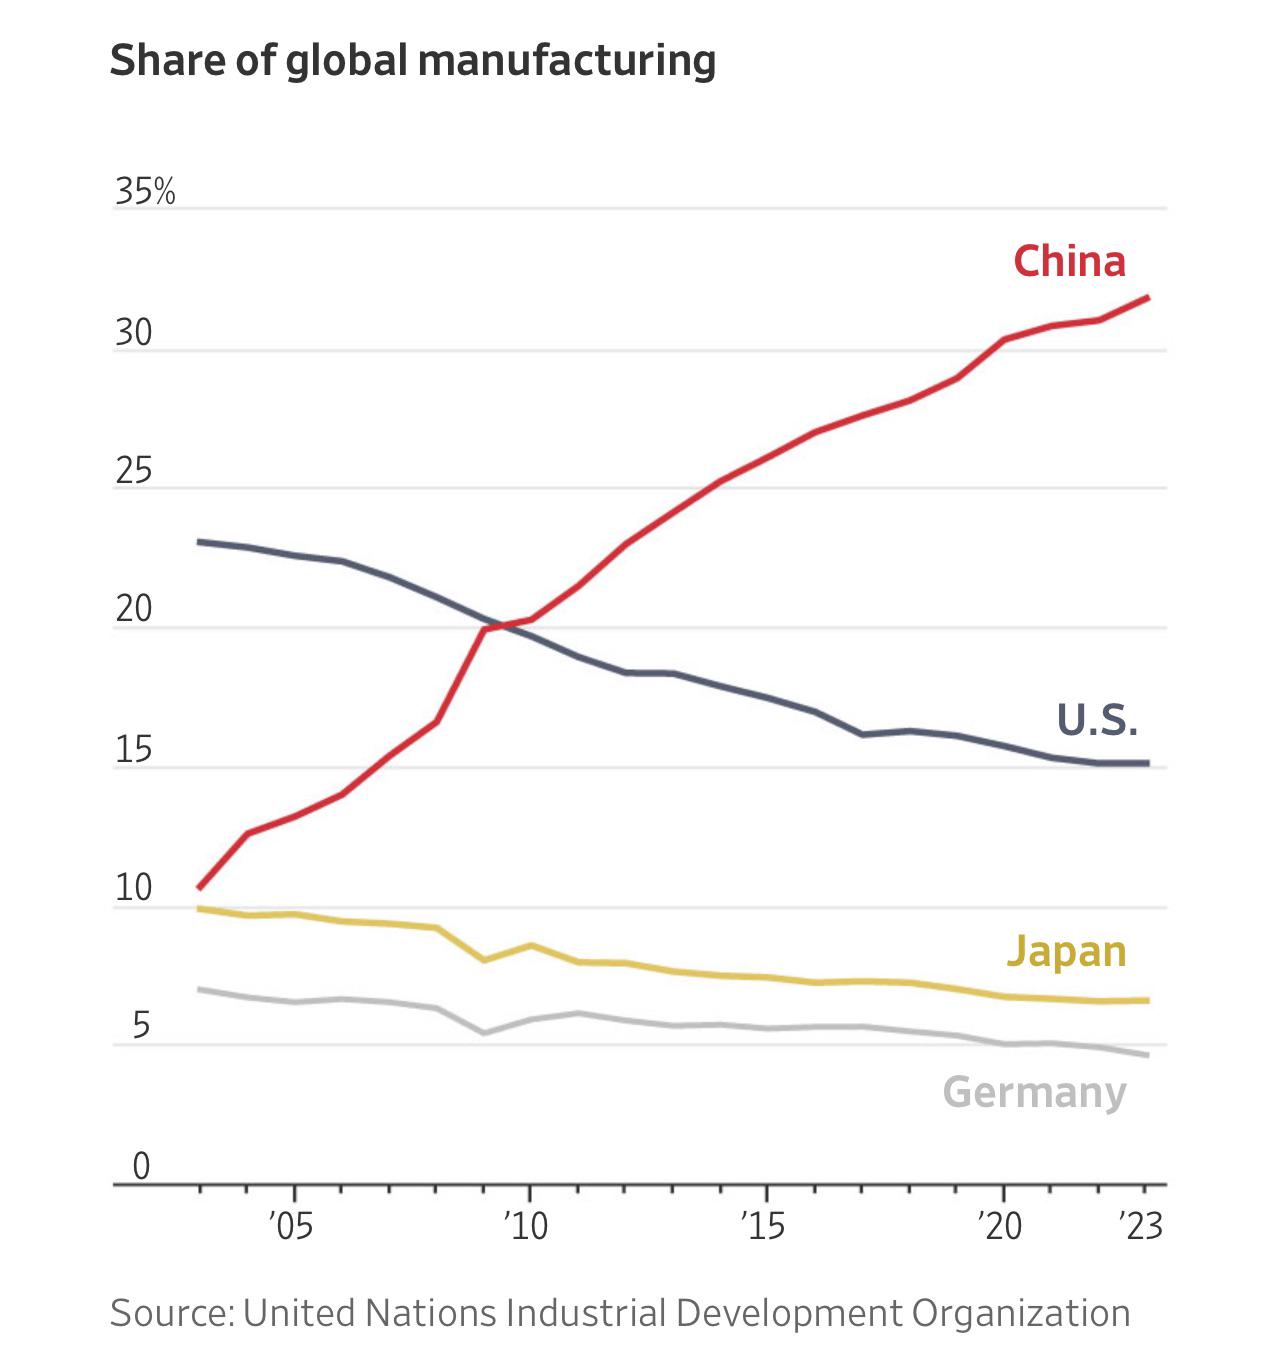
In 1953, the US peaked at 45% of world manufacturing output. Today it is down to 15%
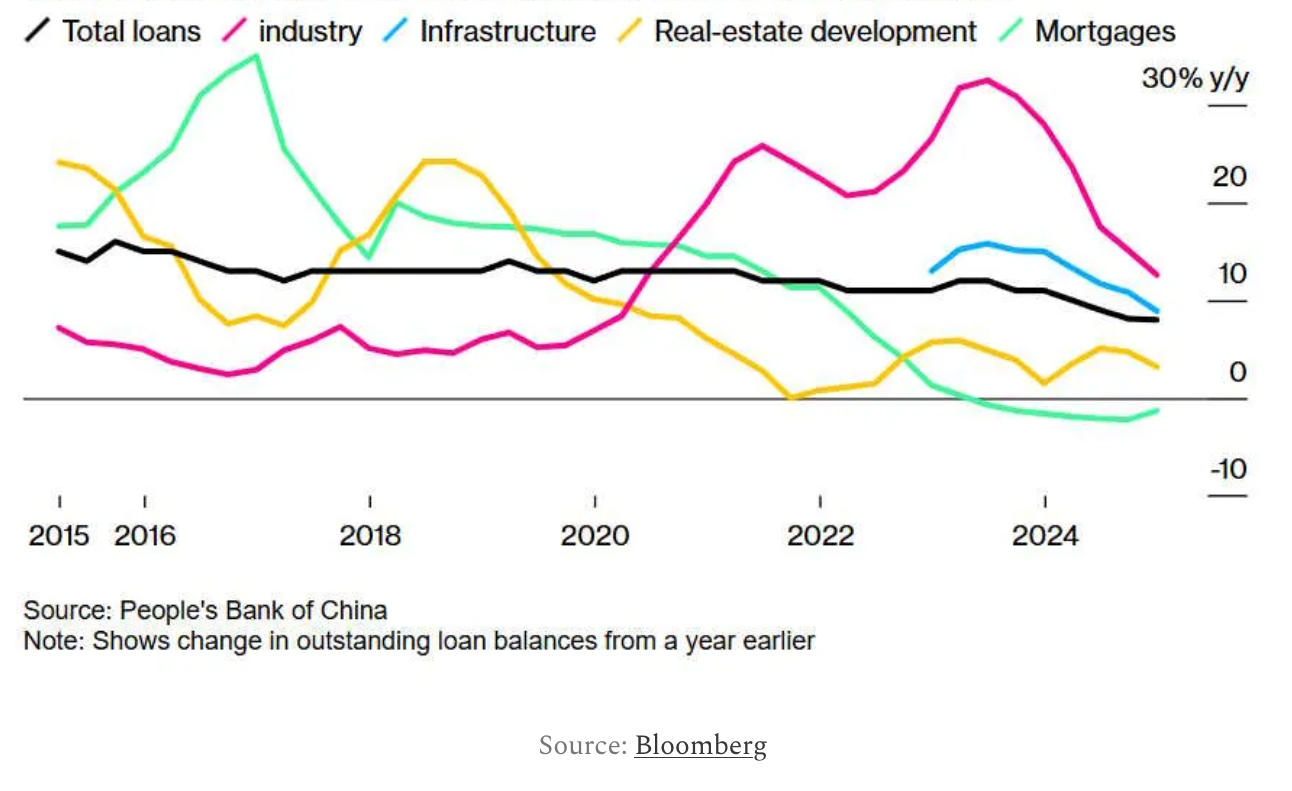
And China’s post-covid growth strategy is to accelerate this even harder.
We can change this though. Unlike oil, there is no predestined reason why some countries should be production powerhouses and others not. Any sufficiently industrialized economy can spin up a solar and battery supply chain if it is made a national priority and is profitable. Remember, today’s world solar production will be a fraction of 2040’s solar production. If China has 5% of total 2040 production built out and the US has 0.1%, that’s roughly the same starting point.
It took a fairly short time for China to dominate, that dominance can be reversed similarly quickly.
There is recent precedent for this.
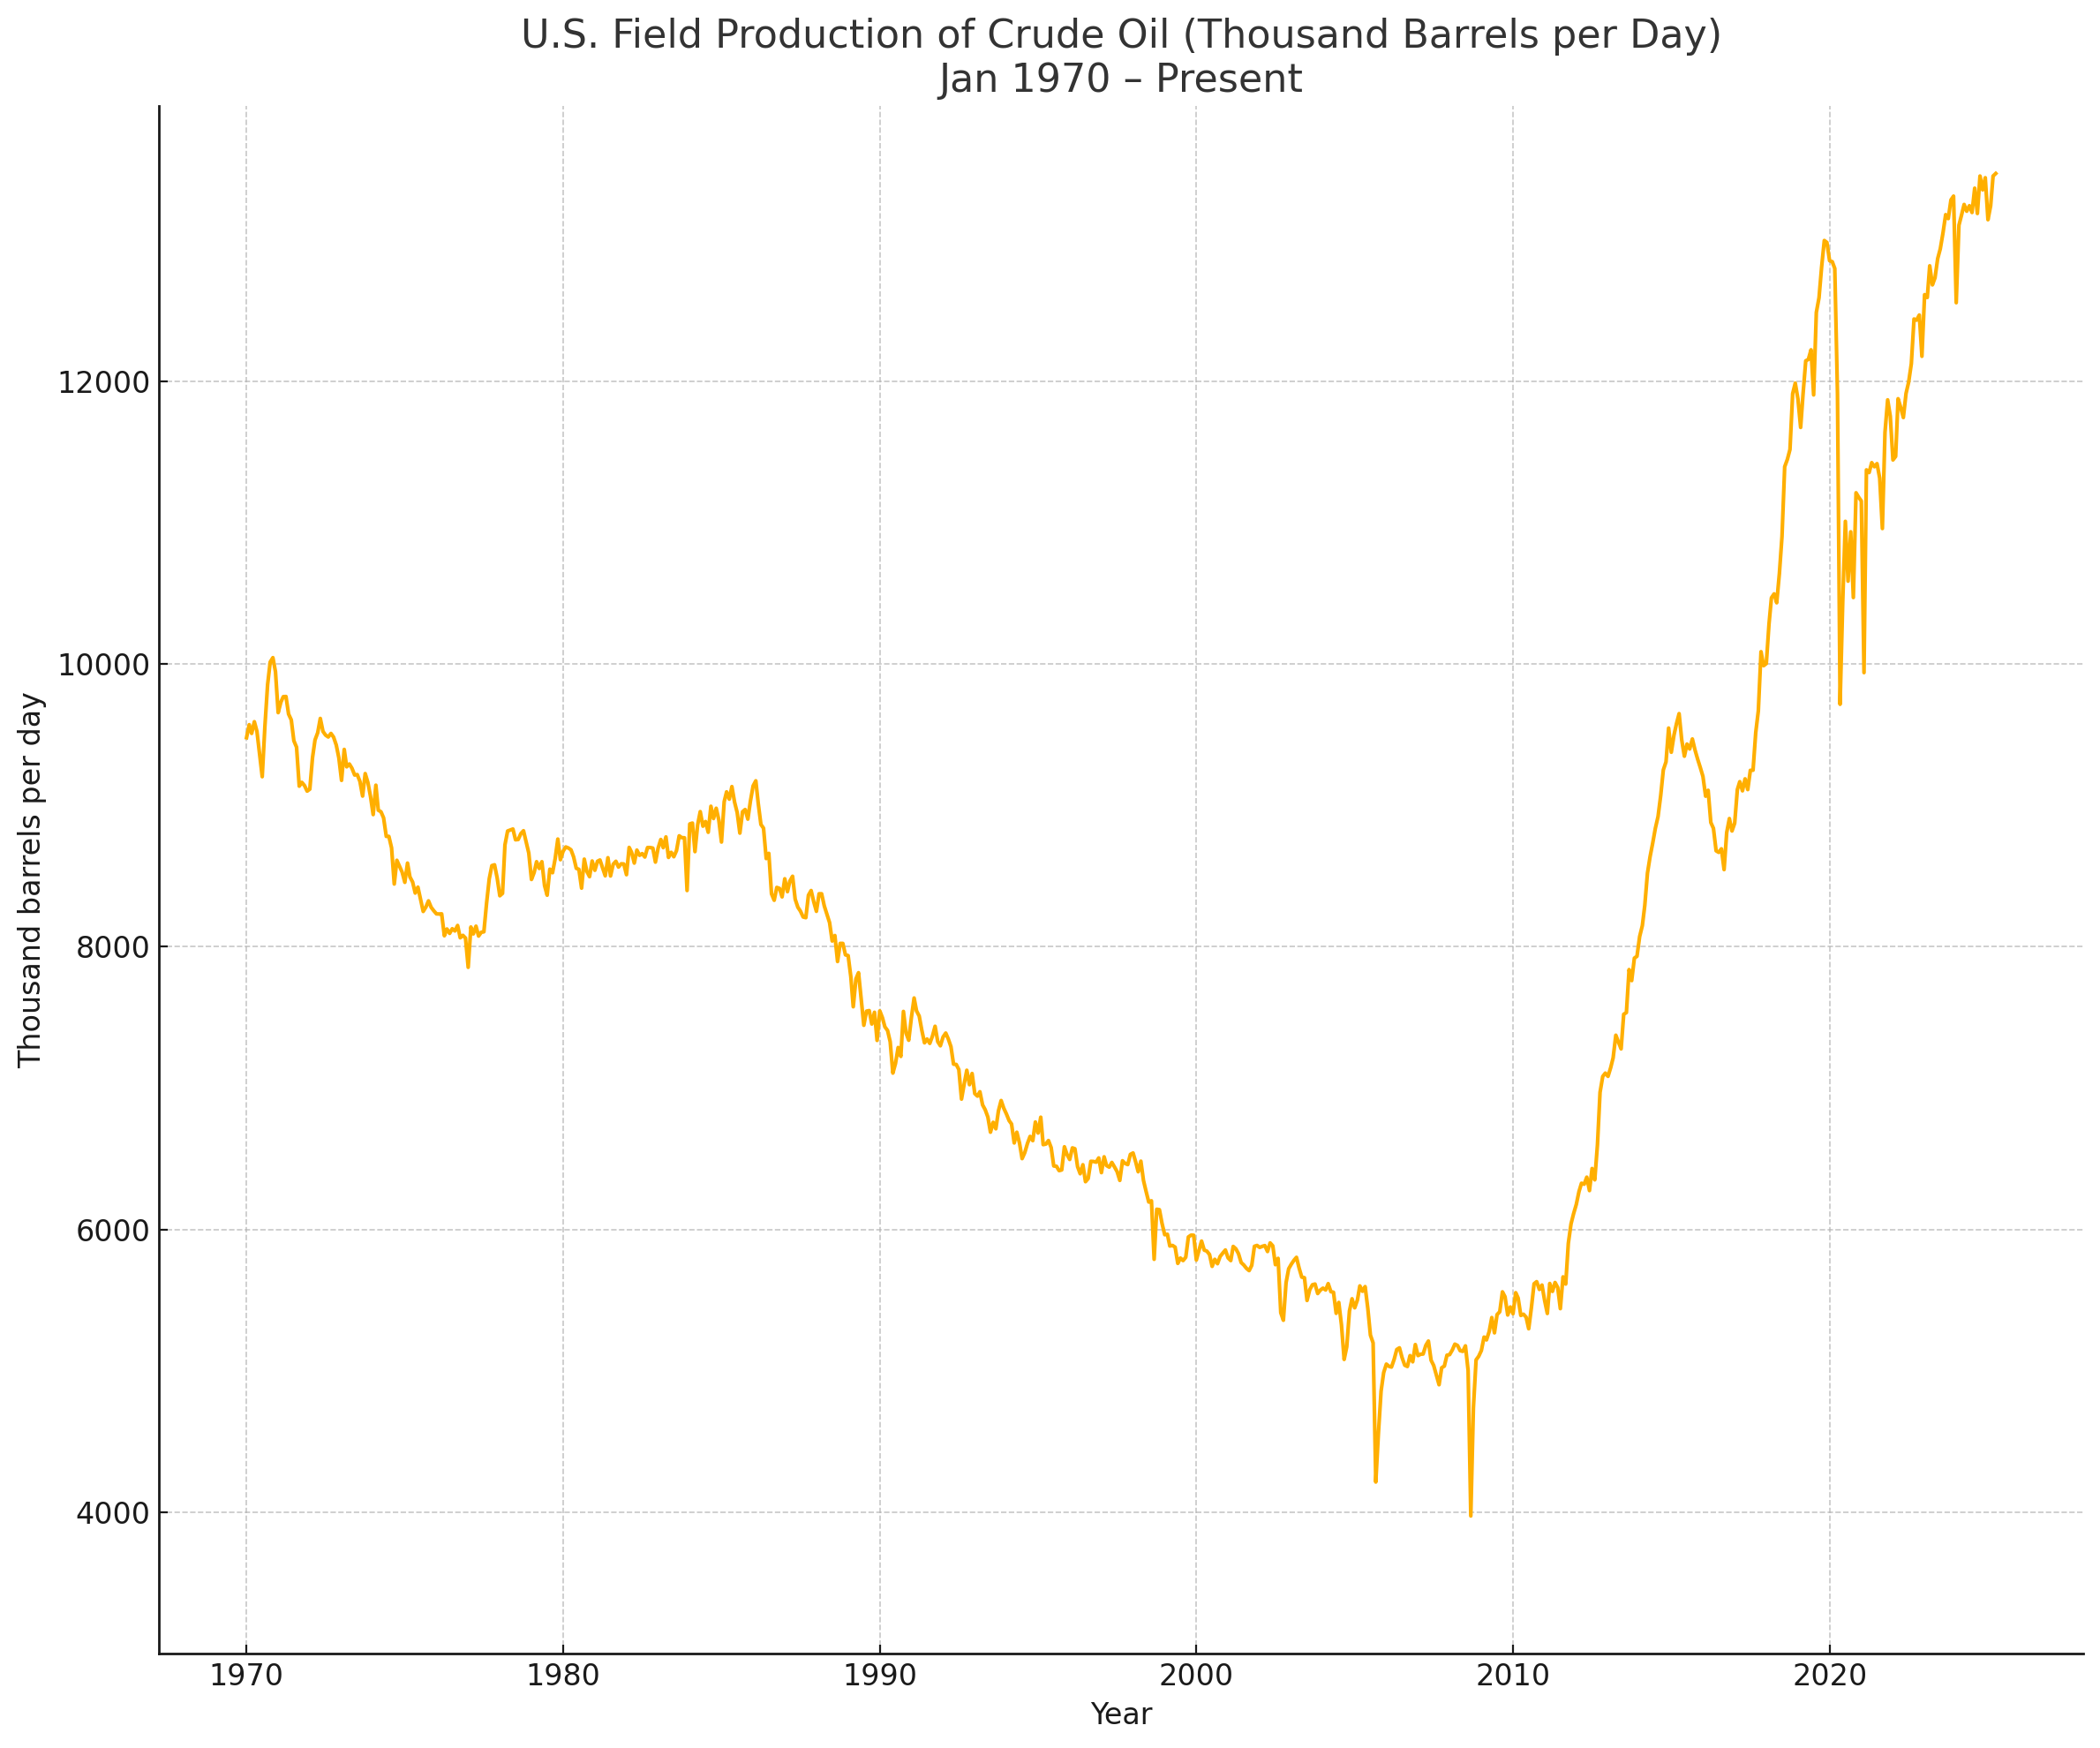
If the promise of profits²² are there, the US financial markets are the most potent capital allocation engine in human history. They financed the US into regaining its position as the preeminent hydrocarbon superpower, bringing an all-time high oil import dependency down to zero in less than 15 years.
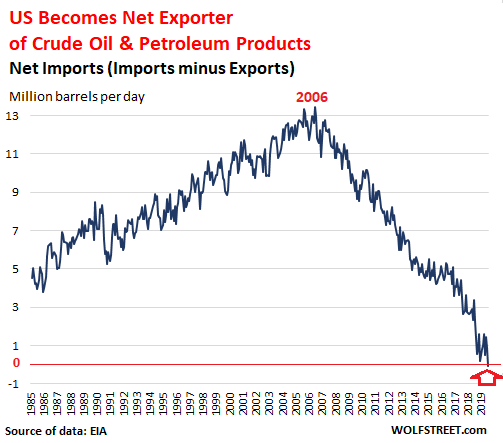
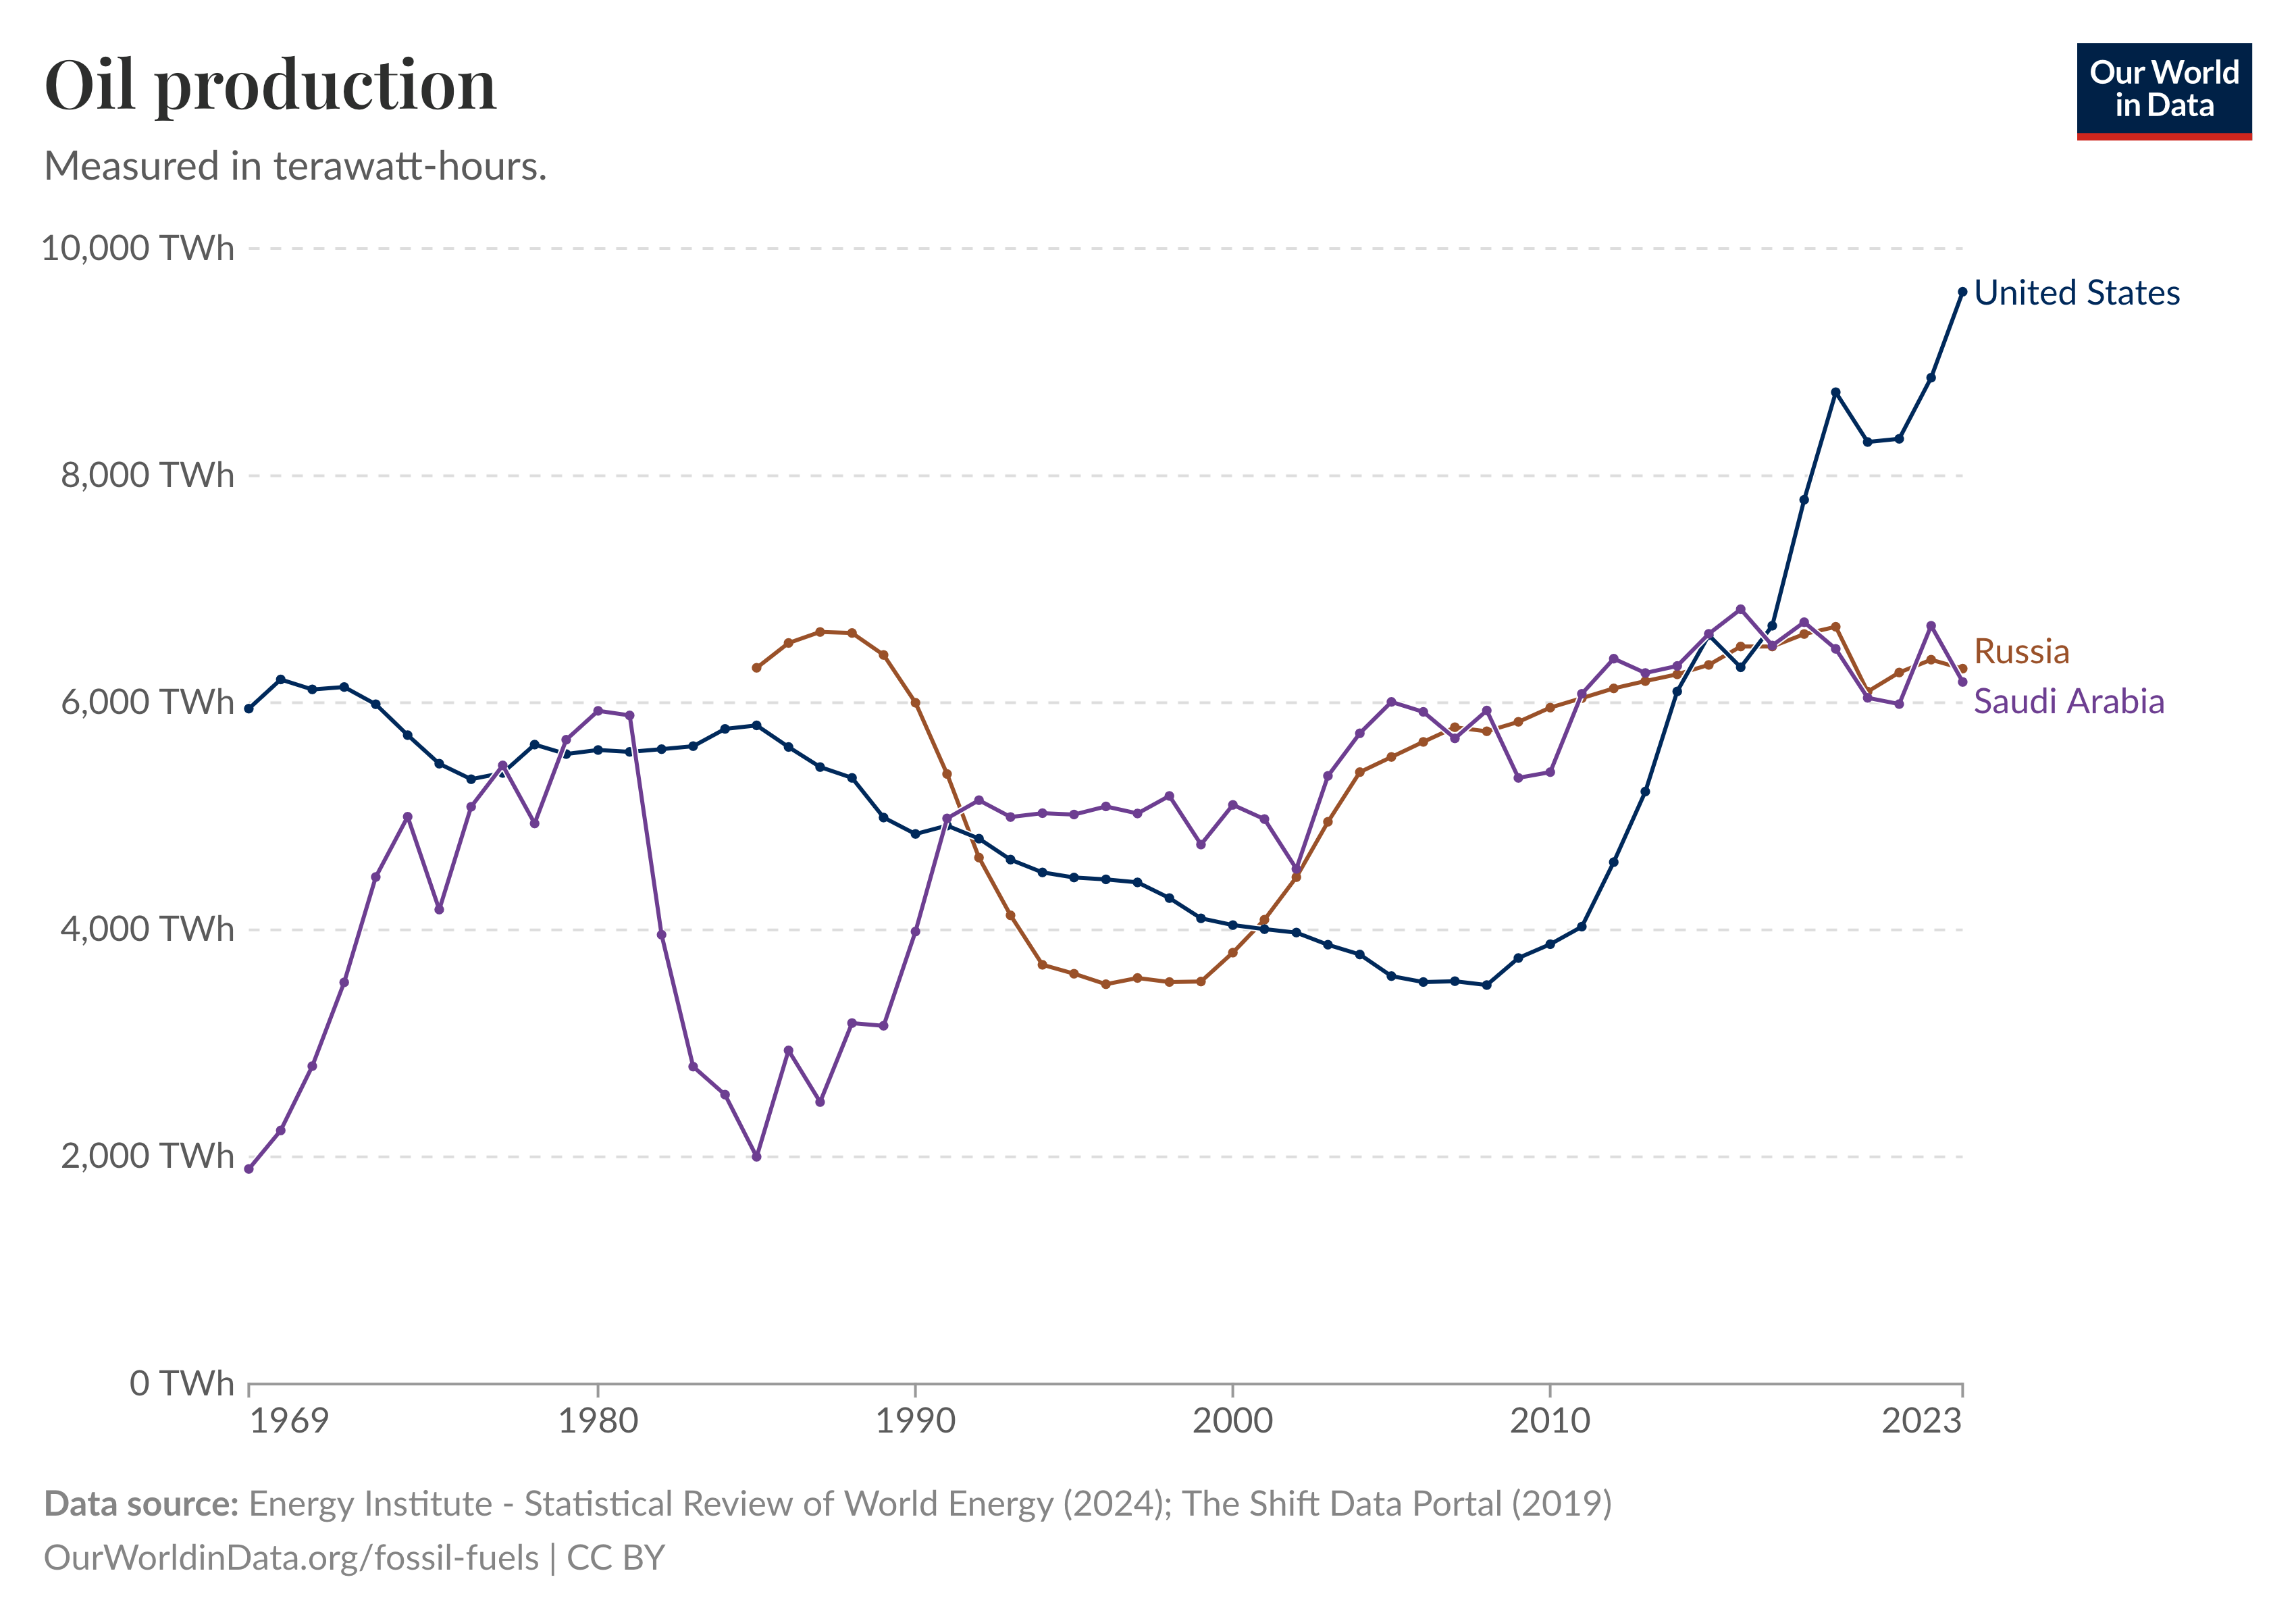
The United States is now by far the largest oil producer on earth.
I’m not bullish on any top down industrial policy to create US dominance in solar, but private financial markets could plausibly be motivated to do the work instead.
The US needs to stop lagging or else the solar industrial revolution will occur elsewhere.
The transition to a solar powered industrial civilization will happen first where solar energy is maximally cheap compared to the alternatives. That is not the US.
Solar power is maximally cheap in the sunniest places with access to cheap solar and batteries. US solar and batteries are uniquely expensive, multiples more expensive than spot prices on the world market. US natural gas, however, is about half the cost of Chinese natural gas, and a third the cost of the world LNG price. The cost calculus in favor of solar over natural gas as a power source in the US will happen much later than in other places. The US has uniquely some of the most expensive solar power in the world and the least expensive natural gas in the world. Methane is too cheap, tariffs too high. It is possibly the worst place on earth to run a solar industrial business. Any thing you can do profitably within the US can be done even more profitably outside the US. Margins larger, growth is faster. For a company hoping to be on the leading edge of the SIR, deployment first in the US is obviously nonsensical. It makes sense to look elsewhere. Sunny places with cheap imports and expensive energy alternatives. Chile is ideal. It has a free trade agreement with China that gives them access to the cheapest modules and batteries, it’s the sunniest place on earth, and it has extensive energy-intensive industrial activity. Australia, Saudi Arabia, and the UAE are other good options.
By length, I’ve spent basically this entire essay trying to find a solution to every problem I could come up with for why this won’t work. I’ve disproved most of them. This is the surest bet of a underrated world shattering opportunity I’ve come across in my life. This is ICs in the 60s, the internet in the 90s. The path is clear to those who look, we just need to build it out.