WTF 1973
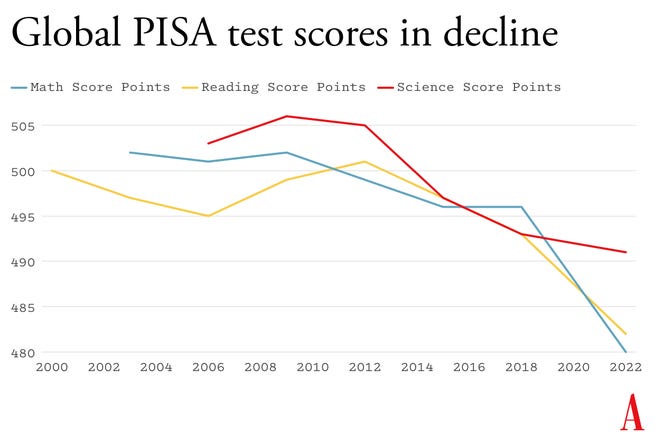
Why the singularity was cancelled.
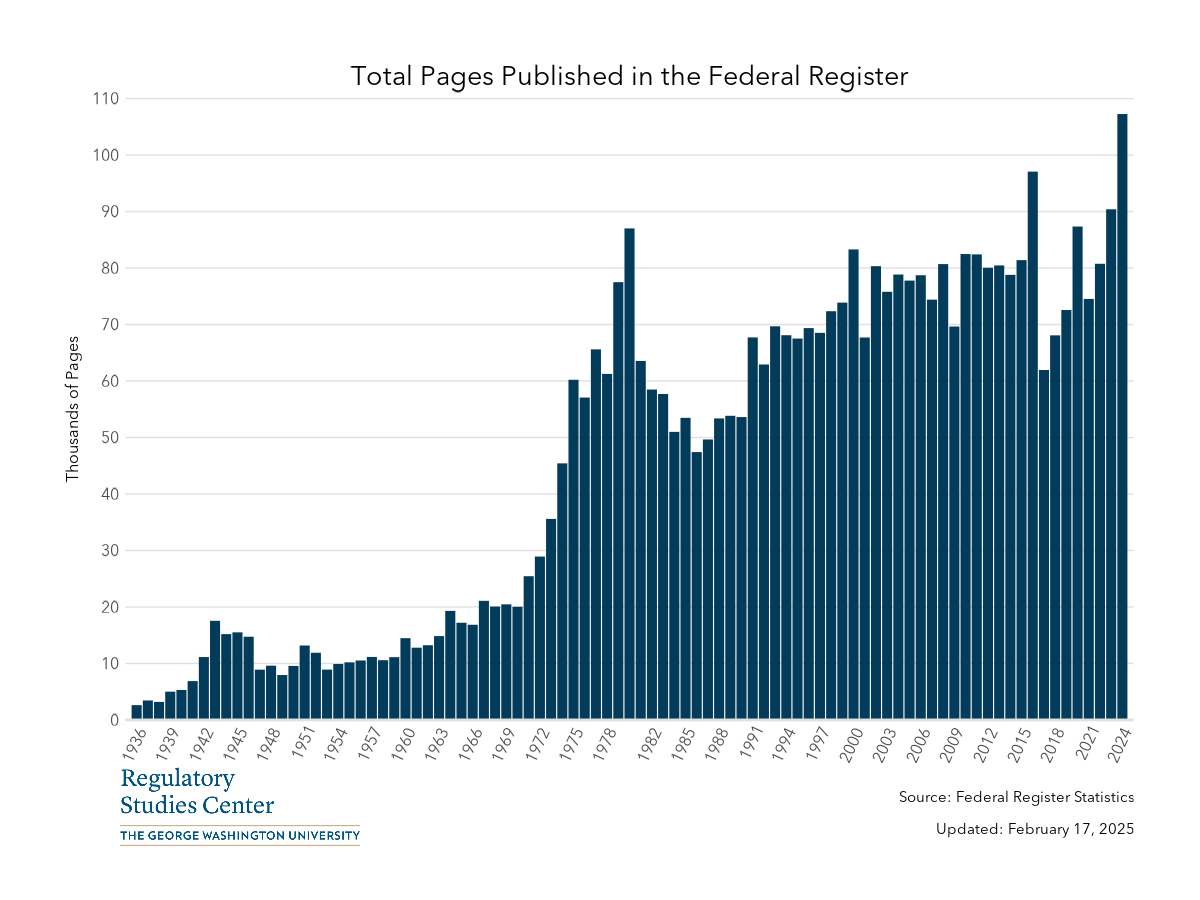
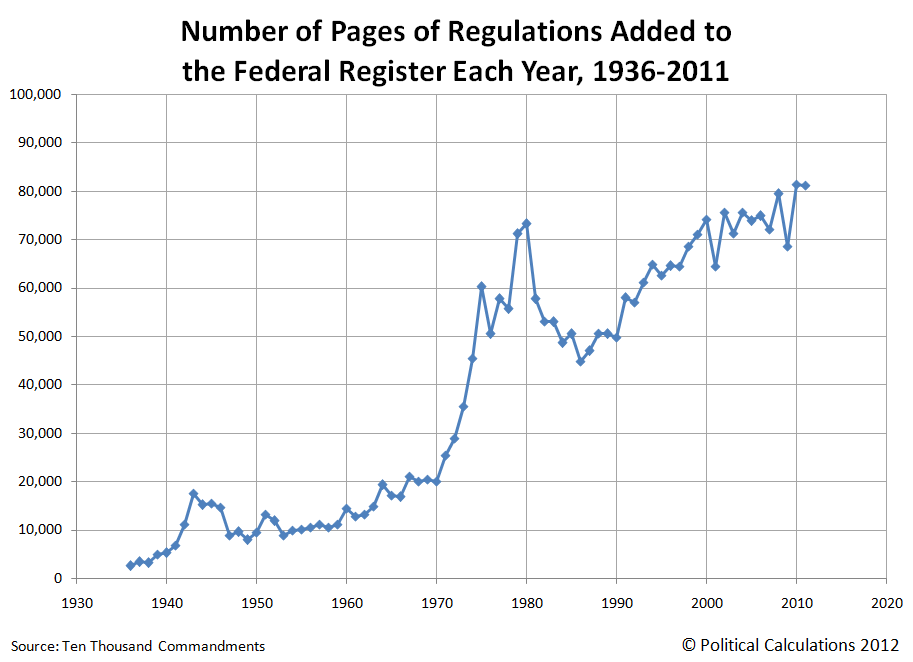
For 10,000 years, human population, GDP, and technology followed hyperbolic growth heading toward a singularity in 2026. A simple model with remarkably high R² values predicted this trajectory—until the 1970s. Something had to give. The world population growth rate peaked in 1963, and GDP growth followed in 1973. This essay explores what happened and why the singularity was cancelled.
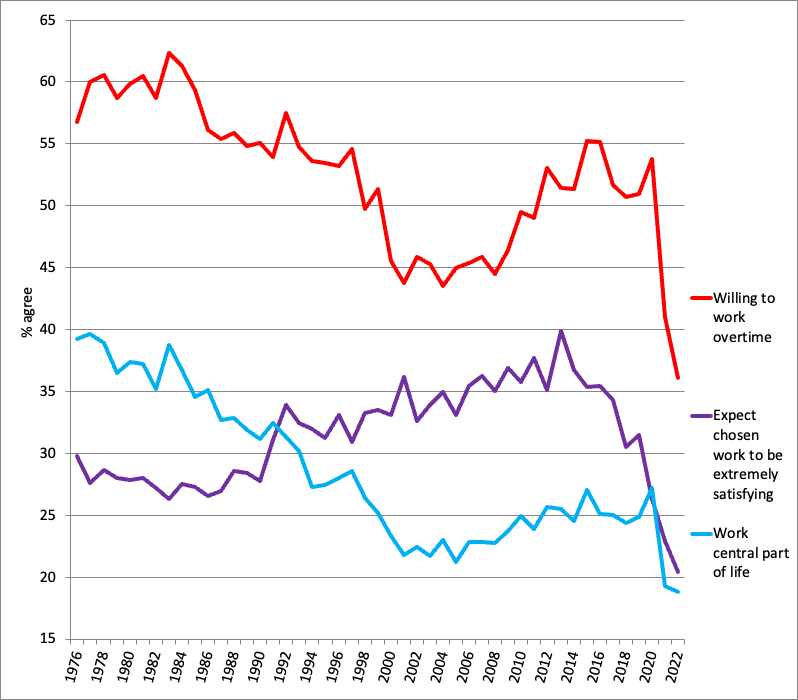
The following is my schizo obsession from last winter about wtf happened in 1973 of wtfhappenedin1971.com fame. Just about every chart of social or economic trends reverses direction or hits an inflection point somewhere around this time. Nothing Big happened this year that would be taught about in a history class. Notably you can find piles of graphs where trends just plow straight through the Great Depression or WW2 uninterupted. Since then every time I’ve run into something weird that occured in roughly 1973 +- 10 years I’ve added it here. There are some other shapes like the circa 2012 something smartphone social media political convolution that are also thrown in here. I’m gonna leave my unedited steady evolution of why I thought it happened as I added more graphs. I have procrastinating polishing this for a year and it is better out there messy.
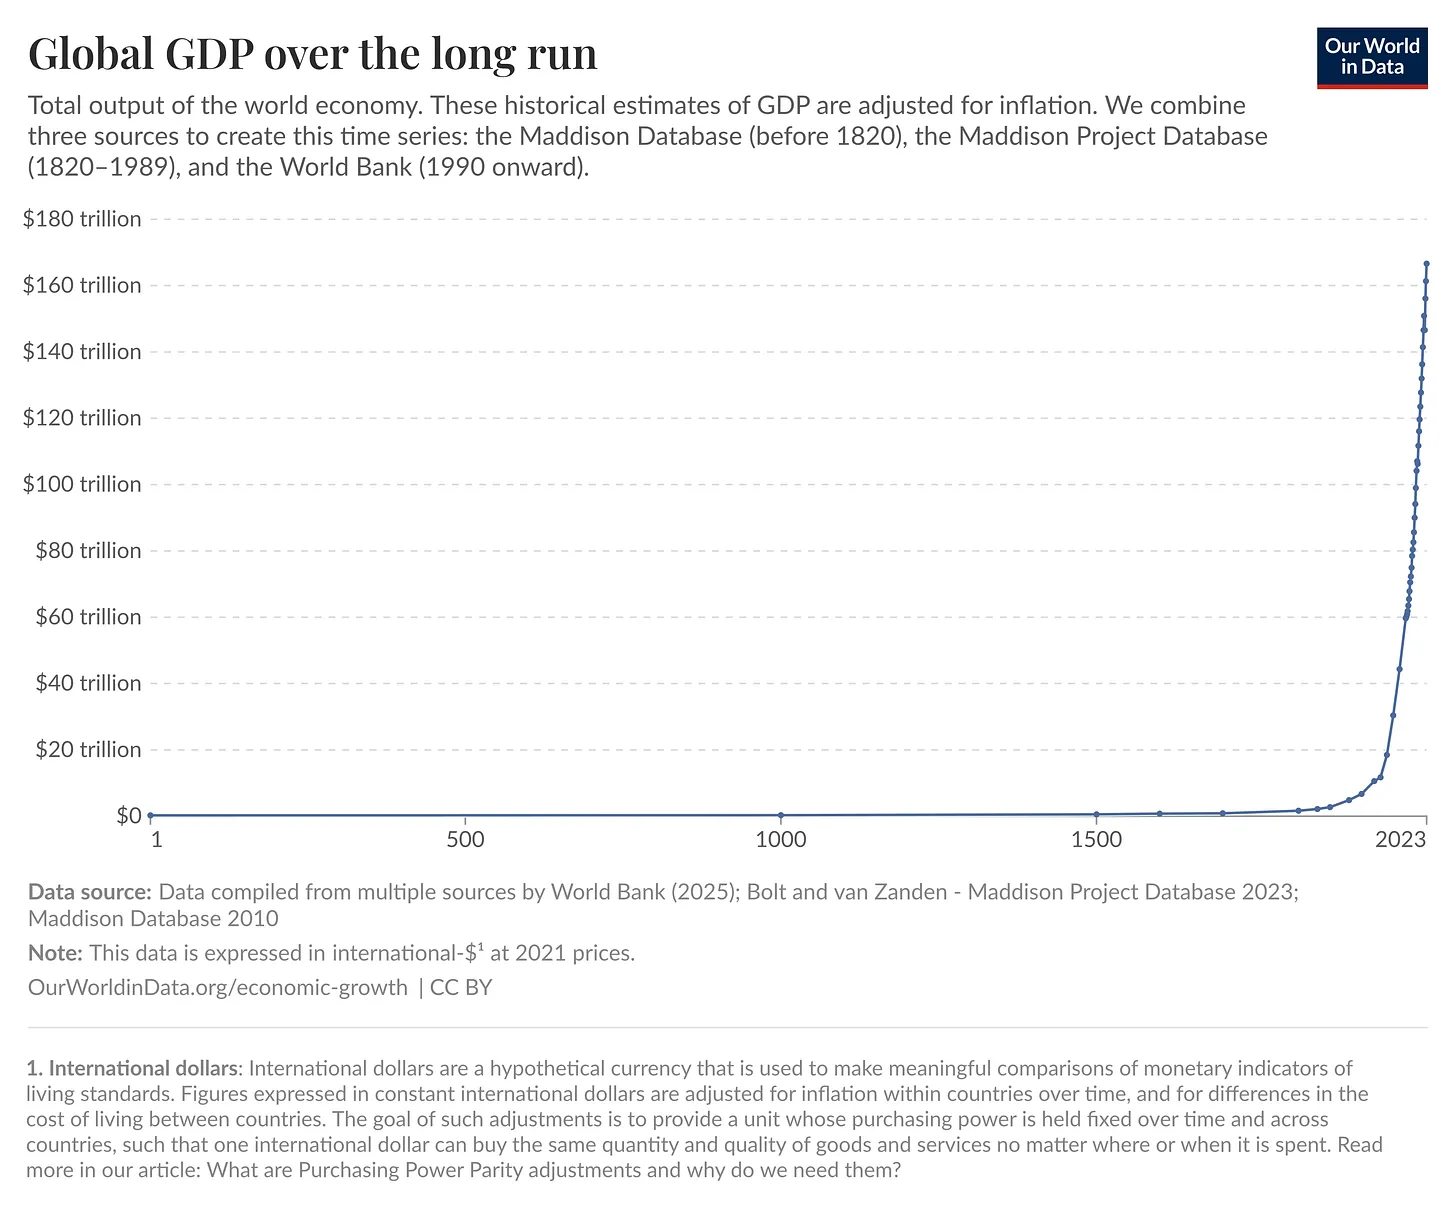
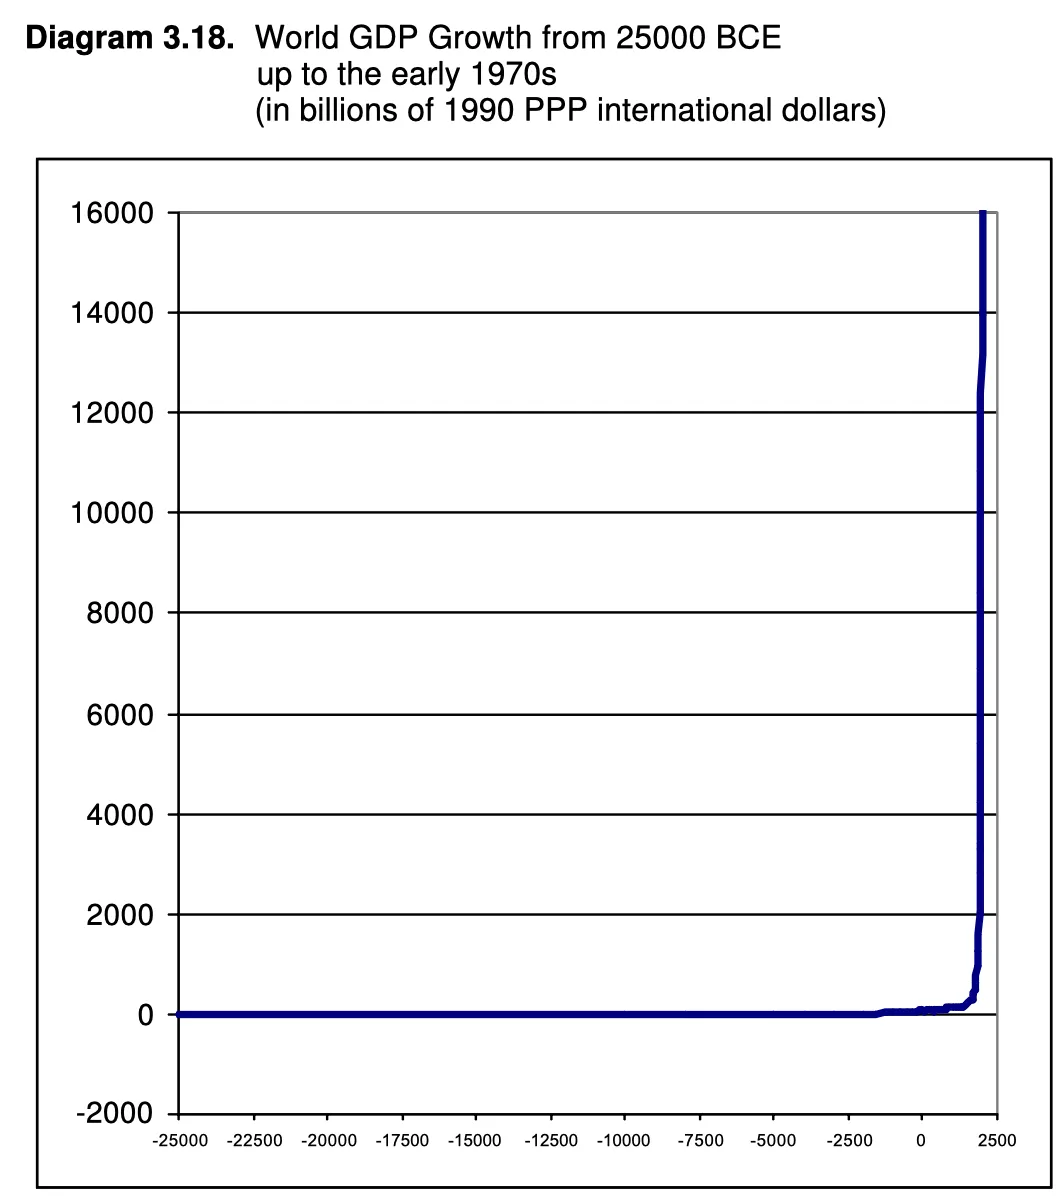
Hyperbolic model: Assume that the technological rate of progress is a function of population. (more people means more 1 in 1000 geniuses). Assume that population is a function of the carrying capacity of a finite amount of land. (Can feed more people on a single acre). Assume that carrying capacity is a function of the level of technological progress. (More tech means better techniques to grow food). More people means more inventions means higher carrying capacity means more people. These assumptions create a non-linear second order positive feedback loop in which progress, gdp, and population go to infinity in finite time. Hyperbolic growth with a singularity — specifically in 2026. It turns out that for the last ten thousand years of human history, this simple model is remarkably accurate at predicting the human population, gdp, and level of technological maturity.
Hyperbolic growth yields this famous chart:
This is akin to a very simplistic version of Asimov’s psychohistory. Just as the individual movements of gas particles are nearly impossible to predict but their behaviors as a whole are approximated by the simple ideal gas laws, so too it seems with human civilization.
“This could be regarded as a striking illustration of the fact well known in complexity studies – that chaotic dynamics at the microlevel can generate highly deterministic macrolevel behavior. […] To describe the behavior of a few dozen gas molecules in a closed vessel we need very complex mathematical models, which will still be unable to predict the long-run dynamics of such a system due to an inevitable irreducible chaotic component. However, the behavior of zillions of gas molecules can be described with extremely simple sets of equations, which are capable of predicting almost perfectly the macrodynamics of all the basic parameters (and just because of chaotic behavior at the microlevel). Our analysis suggests that a similar set of regularities is observed in the human world too. To predict the demographic behavior of a concrete family we would need extremely complex mathematical models, which would still predict a very small fraction of actual variation due simply to inevitable irreducible chaotic components. For systems including orders of magnitude higher numbers of people (cities, states, civilizations), we would need simpler mathematical models having much higher predictive capacity. Against this background it is hardly surprising to find that the simplest regularities accounting for extremely large proportions of all the macrovariation can be found precisely for the largest possible social system – the human world.”
At any time in the last 10k years — or 4 billion years — if a civilization had the requisite data and mathematics knowledge, they could apply this model and estimate gdp/population/technology at any time in the future until the values go to infinity sometime in the early 21st century. That is, until the 1970s.

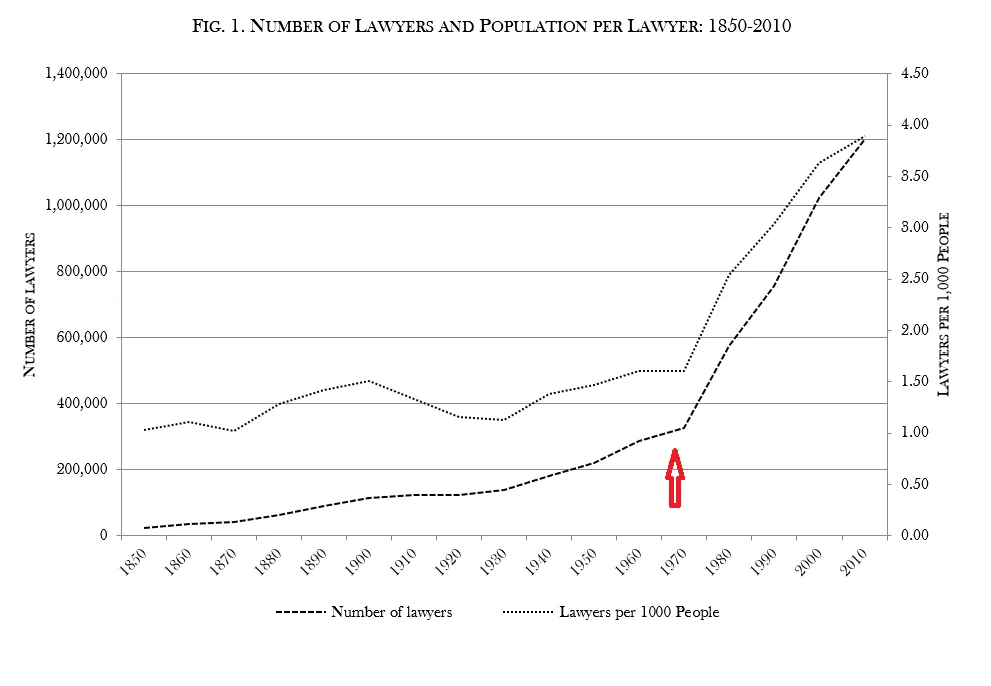
This paper lays out the theory that population increased hyperbolically (1/x) and gdp grew at a quadratic hyperbolic rate (1/x^2) over the long term. R^2 is 0.9991 and 0.9986 respectively for these fits. (This implies that gdp increases with the square of population for most of history (R^2 0.998), which is an interesting result.) (another interesting result is that the industrial revolution wasn’t really a thing, but merely a continuation of a gradual trend when the rate of change got high enough that we gave it a name. This sounds somewhat plausible to me given how slow and unevenly distributed the IR was at first, but how do you account for step function changes like a steam engine?) These trends held true for most of human history until 1963 and 1973 respectively.
Infinite gdp/population/technology is obviously impossible, so something had to give. From first principles, the singularity or “blowup regime” is bottlenecked by minds, matter, and megawatts. Intelligence, atoms, and energy. The first parameter to give out and decouple from the hyperbolic model was intelligence/labor, where the world population growth rate peaked in 1963 at 2.3%. (obviously a kid takes roughly 20 years to be useful, so a peaking rate would only effect the economy with a lag time. That’s why gdp took longer to actually slow. but realistically almost all invention is in the leading edge economies and their birth rates peaked well before 1963, so these two forces balanced out.
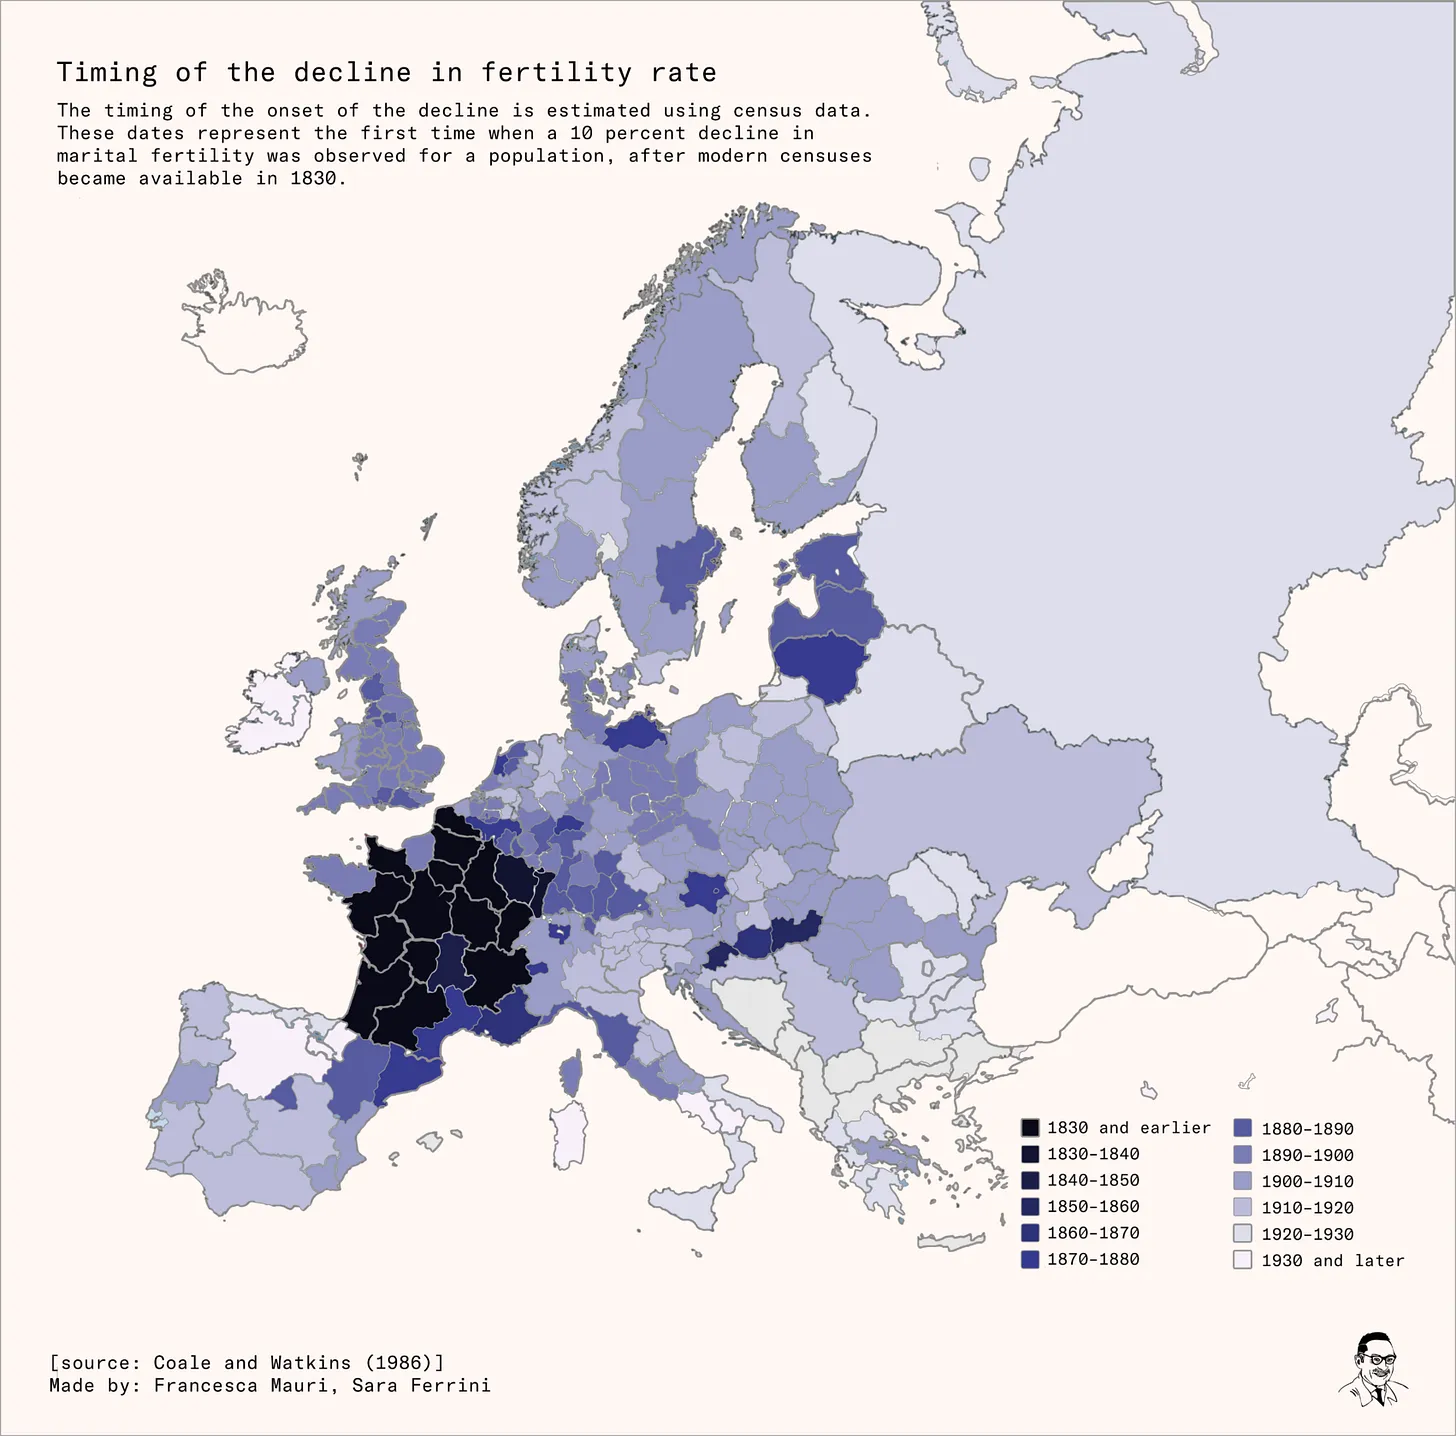
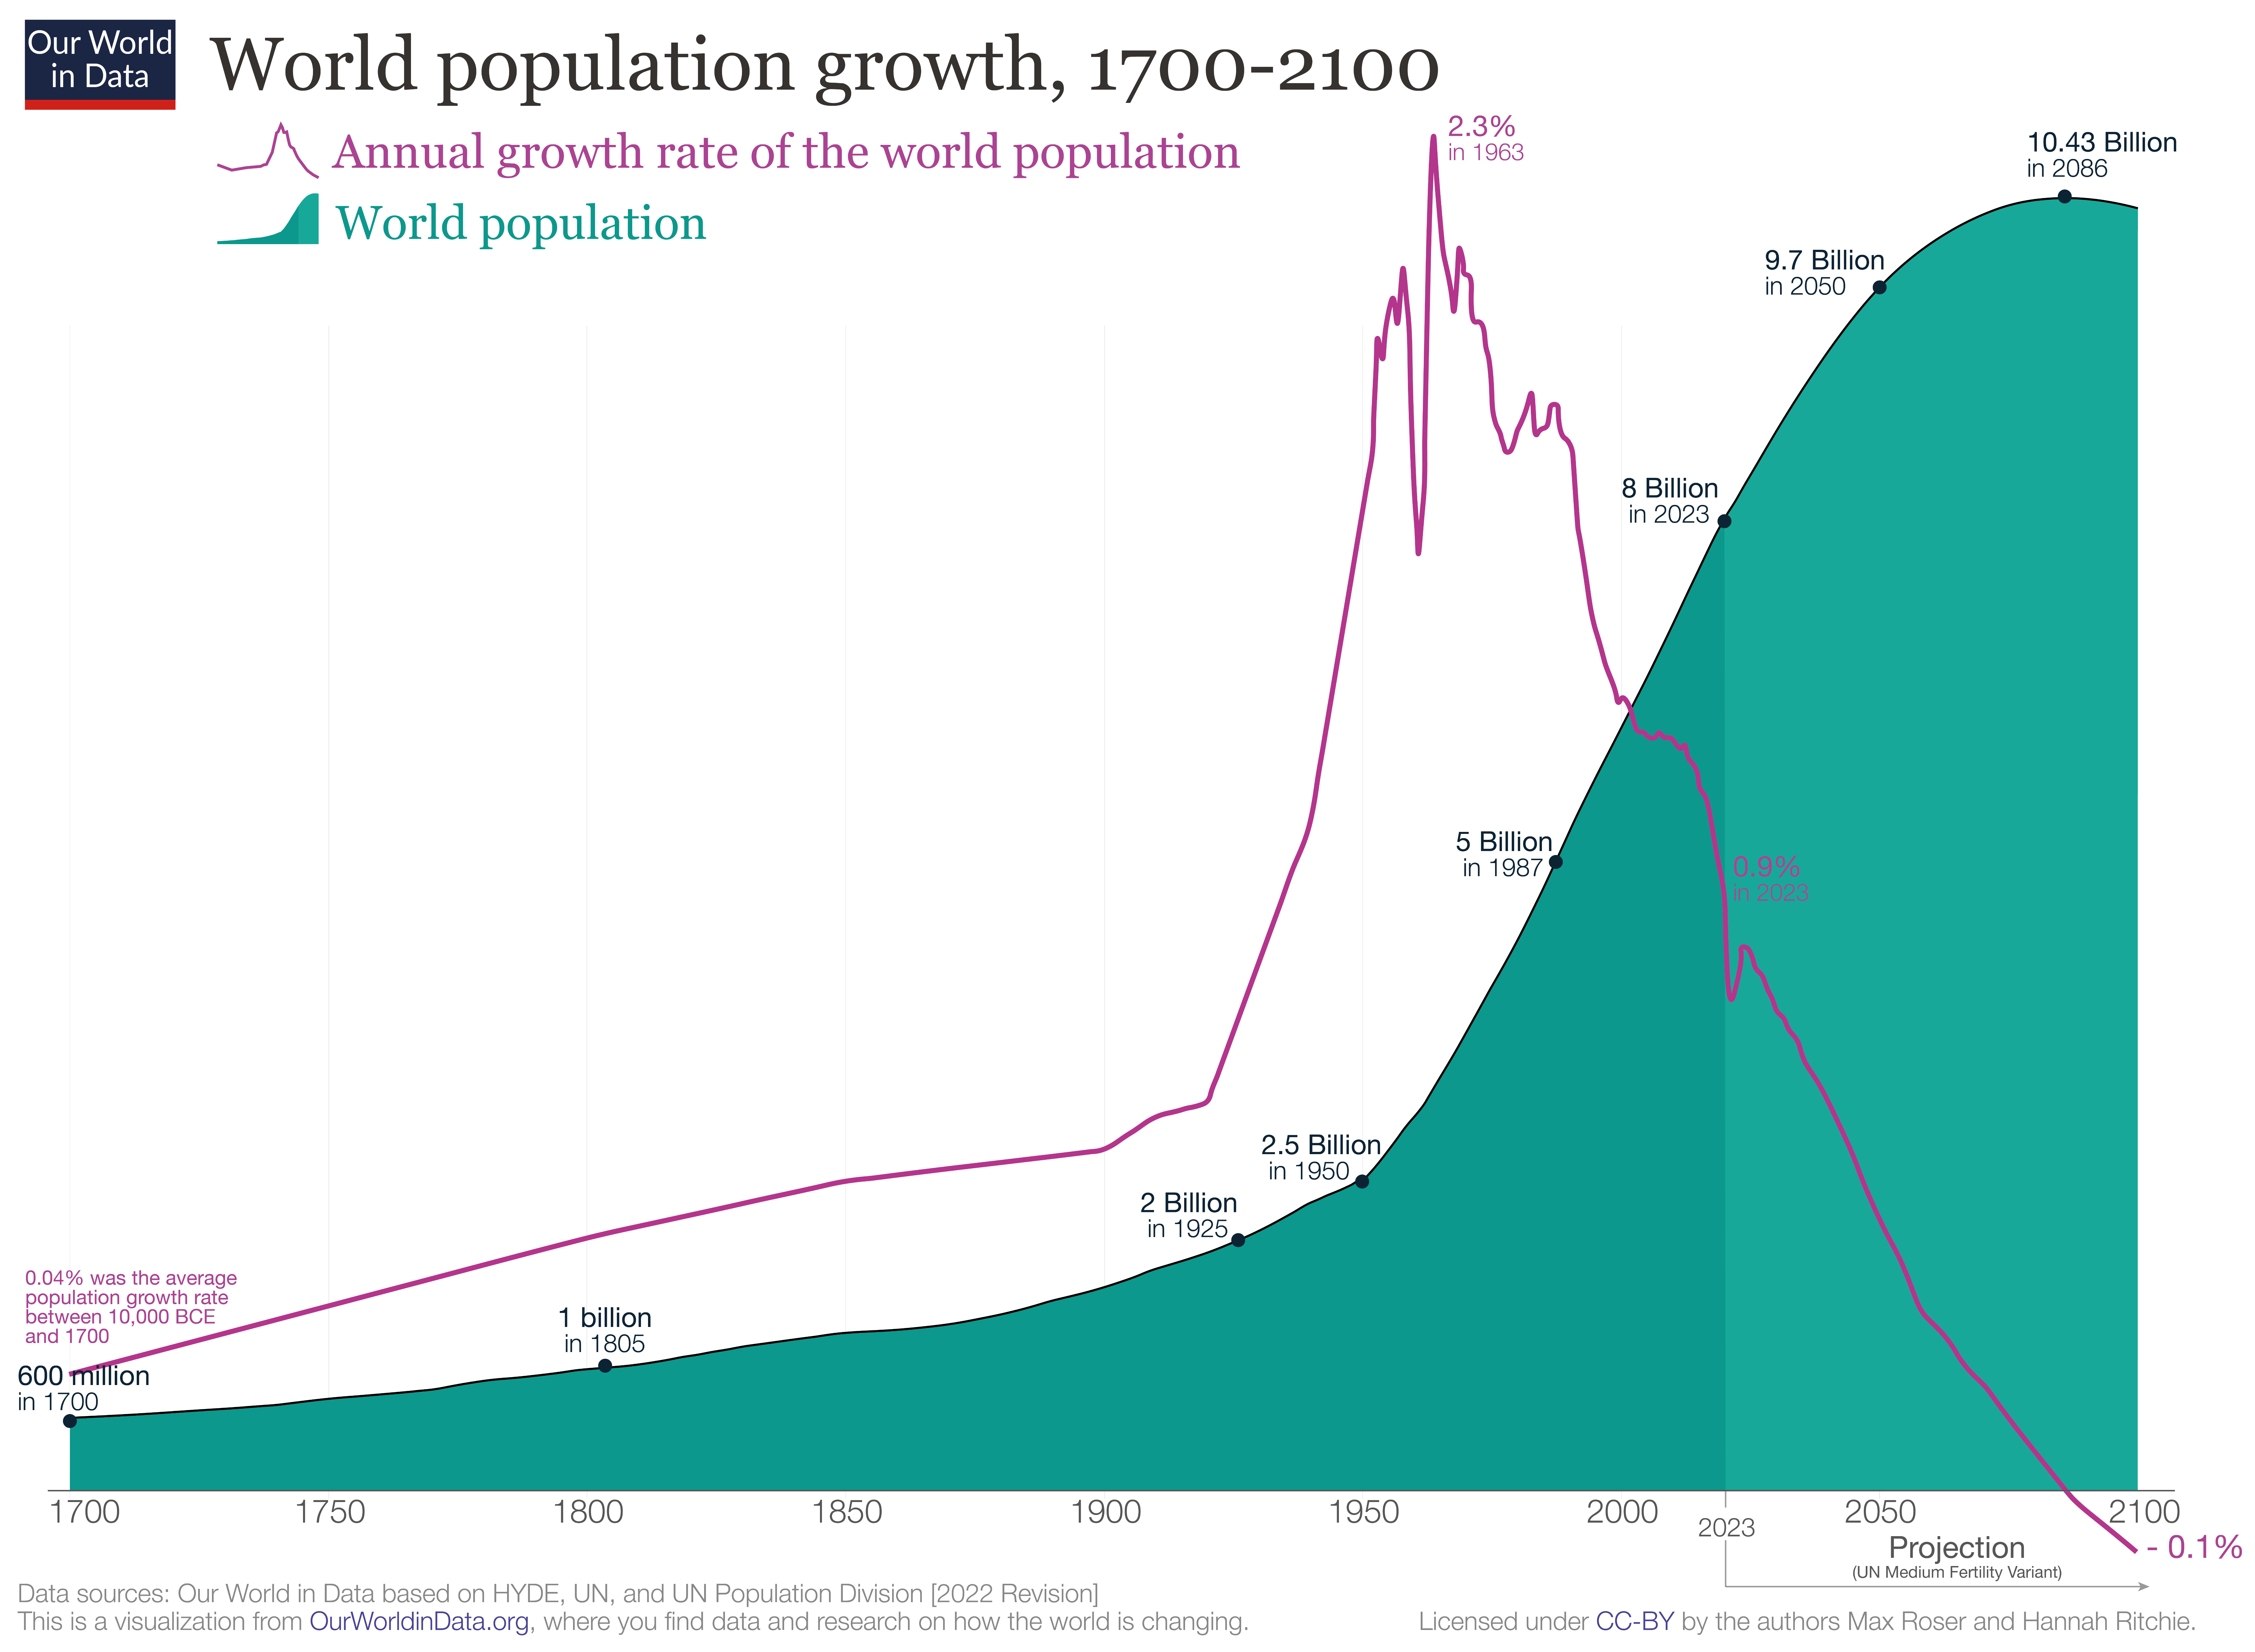
The reasons for the growth rate peak are well established; the demographic transition is something that happens in every country as it gets richer.
Demographic Collapse
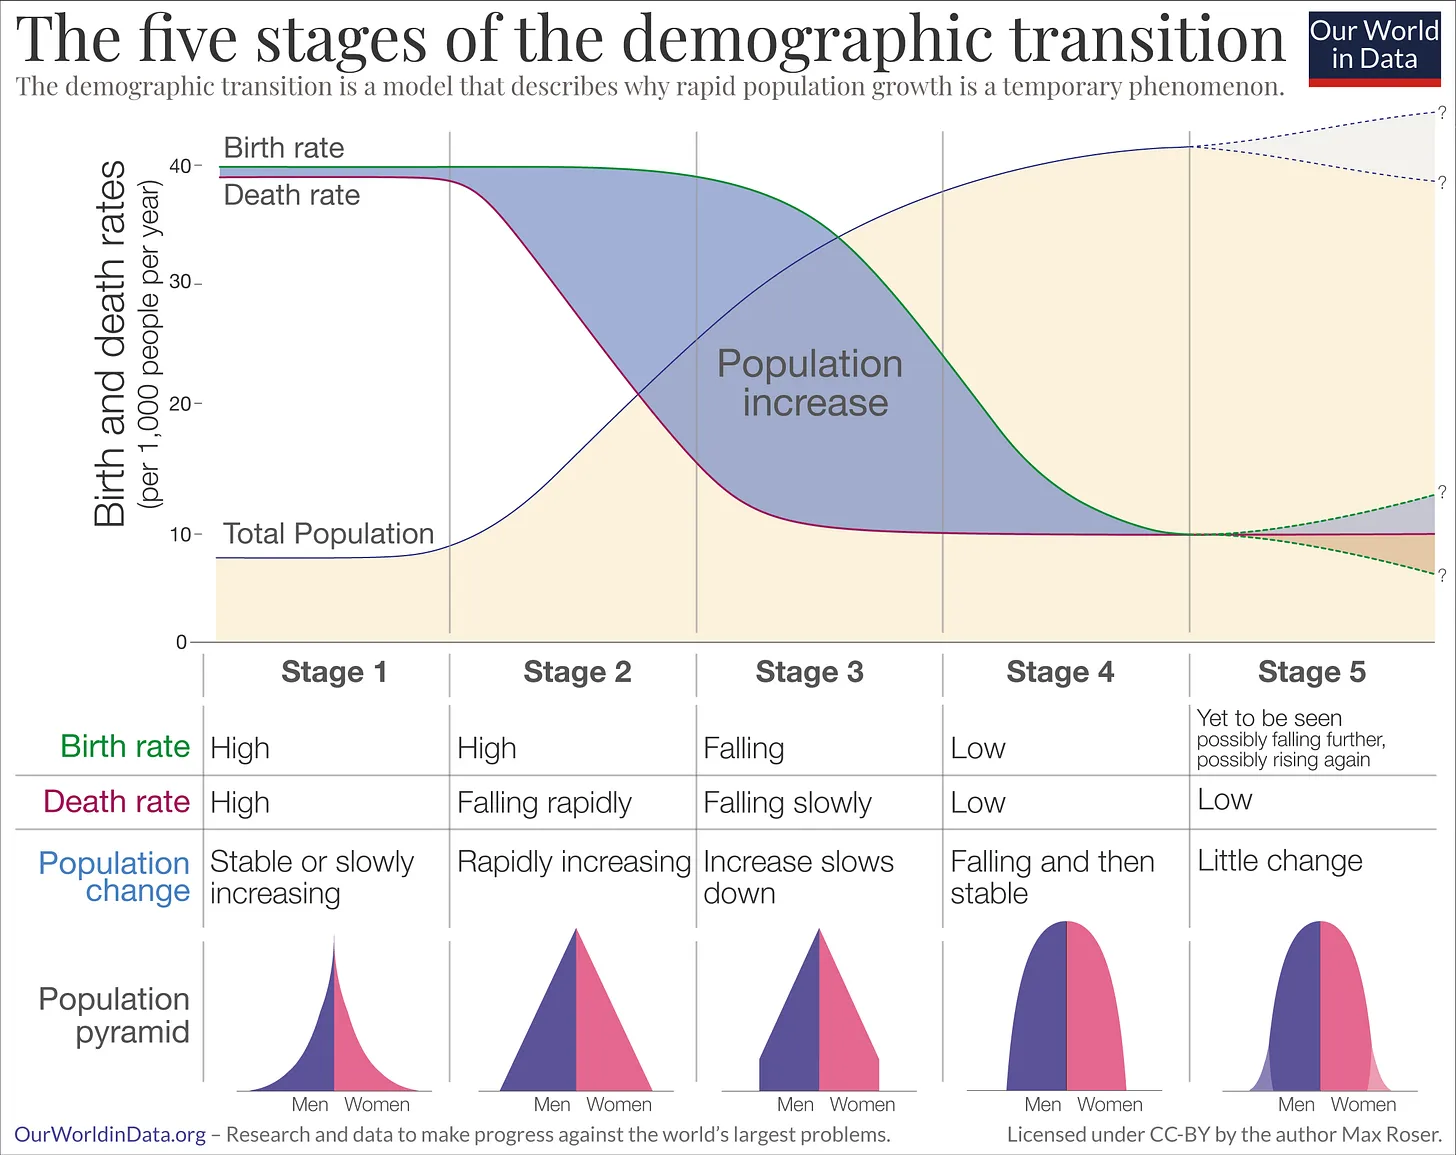
In an undeveloped society, lots of people, kids in particular, die frequently. For the society to survive, they have to have a ton of kids to stay ahead the huge number that are dying. This is a Malthusian steady state. Extremely isolated tribes are the only humans still living in Stage 1.
When a combination of improving food production and healthcare dramatically reduce death rates, the babies born don’t die like they were expected to. The population grows. The poorest regions of Africa are in Stage 2.
The transition period is a unique boon for economic development called the demographic dividend. During this period, there are way more working people than there are old and young people (a low dependency ratio) so the economy is maximally productive. This is the best time to industrialize your country. Western Europe and East Asia have successfully used this boost to rapidly enter the highest echelon of developed countries in their respective transitions. Much of Latin America and the Middle East have missed this boost. A majority of developing countries are here.
Stage 4 is something close to a stable population where birth rates have fallen to where the death rates are. The higher fertility regions of the developed world are here.
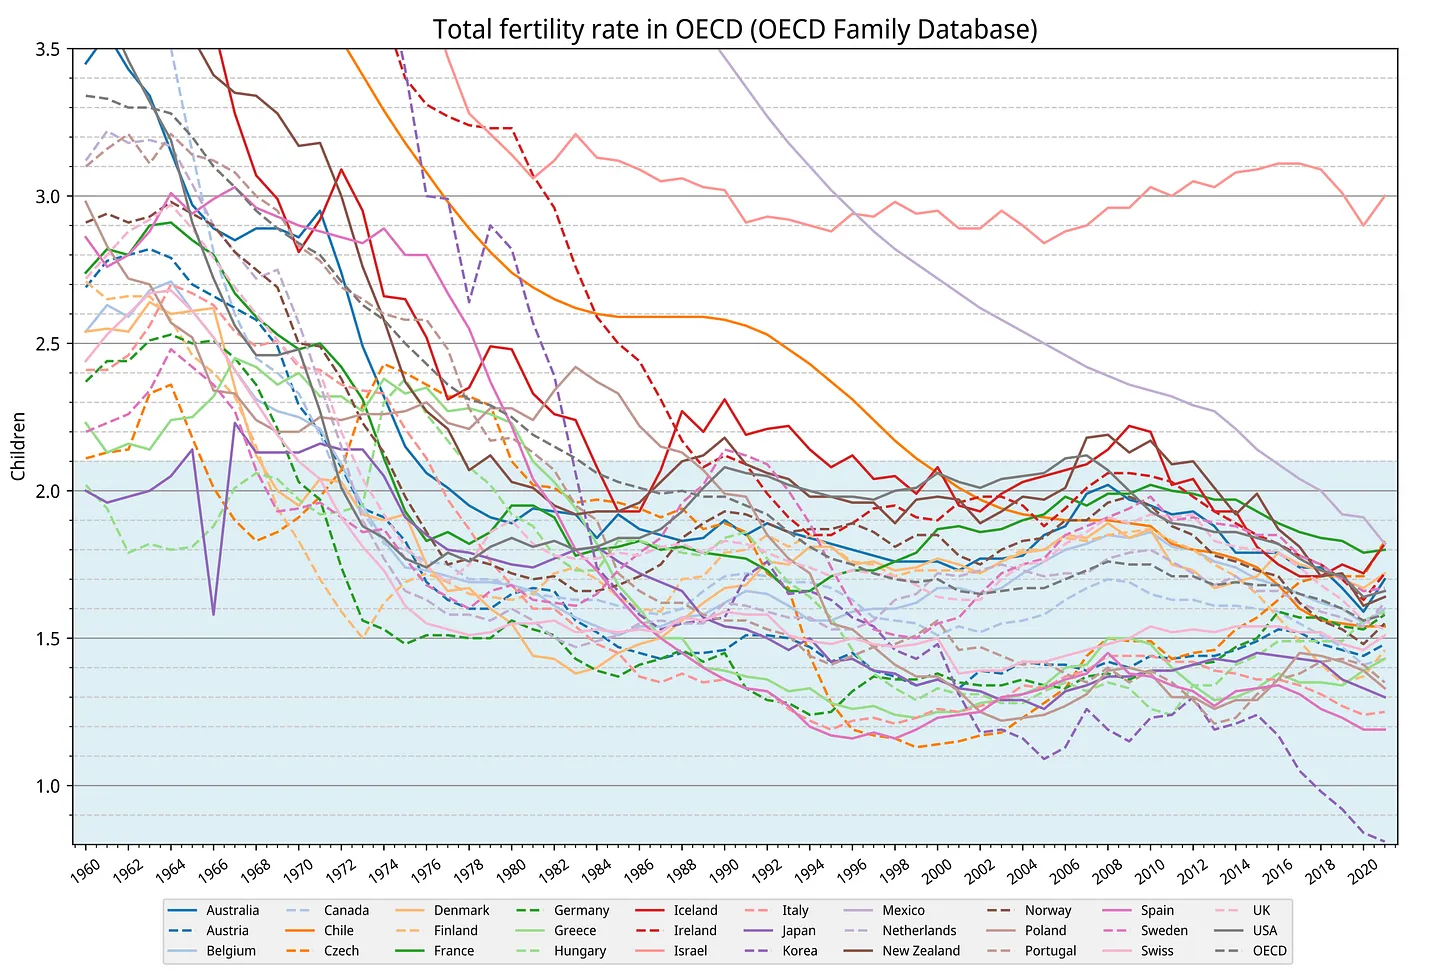
Stage 5 is a new phenomenon. It is yet unknown how the population behaves in the long term. Over the last decade there has emerged substantial evidence that it will decline, with more people dying than being born. This generally just an increasingly popular lifestyle choice by the population not to have a long term partner, not to have kids, or not to have a lot of kids. The incentives of developed economies are not favorable towards children, except as something that brings parents joy. There is to my knowledge exactly one rich country with a birth rate above replacement: Israel. My understanding is that this is basically all due to large families in the most devout Jewish communities.

Anything below 2.1 implies a shrinking population
South Korea is the most dramatically bad. At a total fertility rate (TFR) of 0.7, 200 Koreans will have 70 kids. Those 70 will have 24.5 kids. Those 24.5 will have 8.6 kids. 200 Koreans today can expect to have less than 9 great-grandchildren among them.
At the same time the demographic dividend boon is reversed; there are many more old people than working age people, meaning that pension, welfare, and healthcare systems are extremely stressed
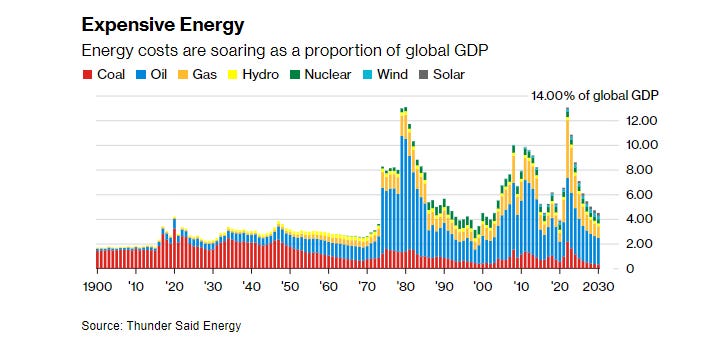
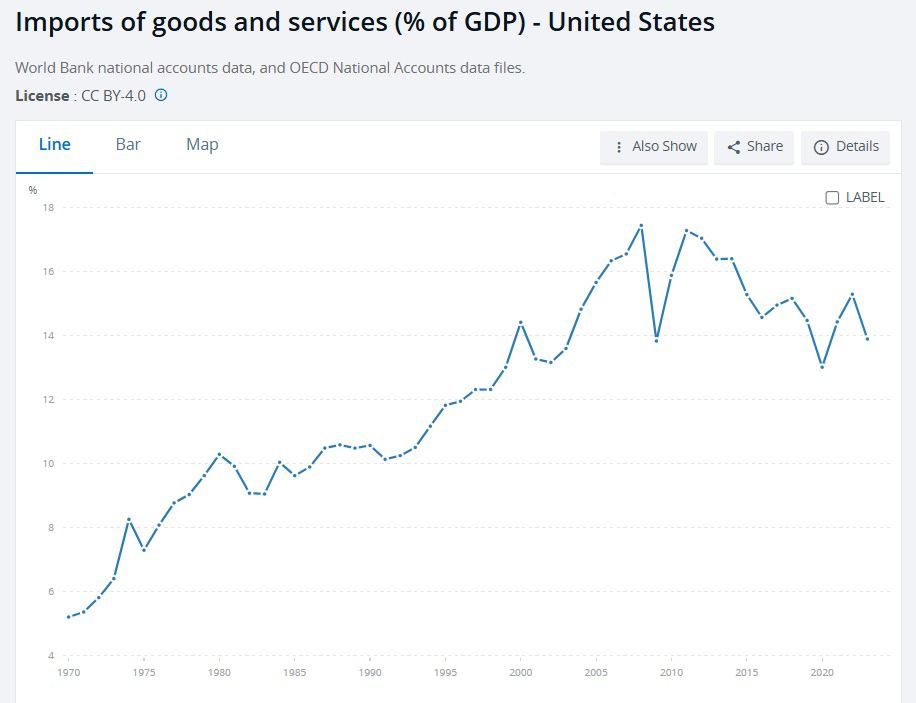
Despite the population growth rate slowdown, the world economy kept growing hyperbolically until 1973, when the energy parameter gave out.
A singularity of course requires infinite energy. This doesn’t really exist, at least not when you’re digging your energy out of the ground and combusting it. We ran into the limits of our energy sources in the late 60s and early 70s.
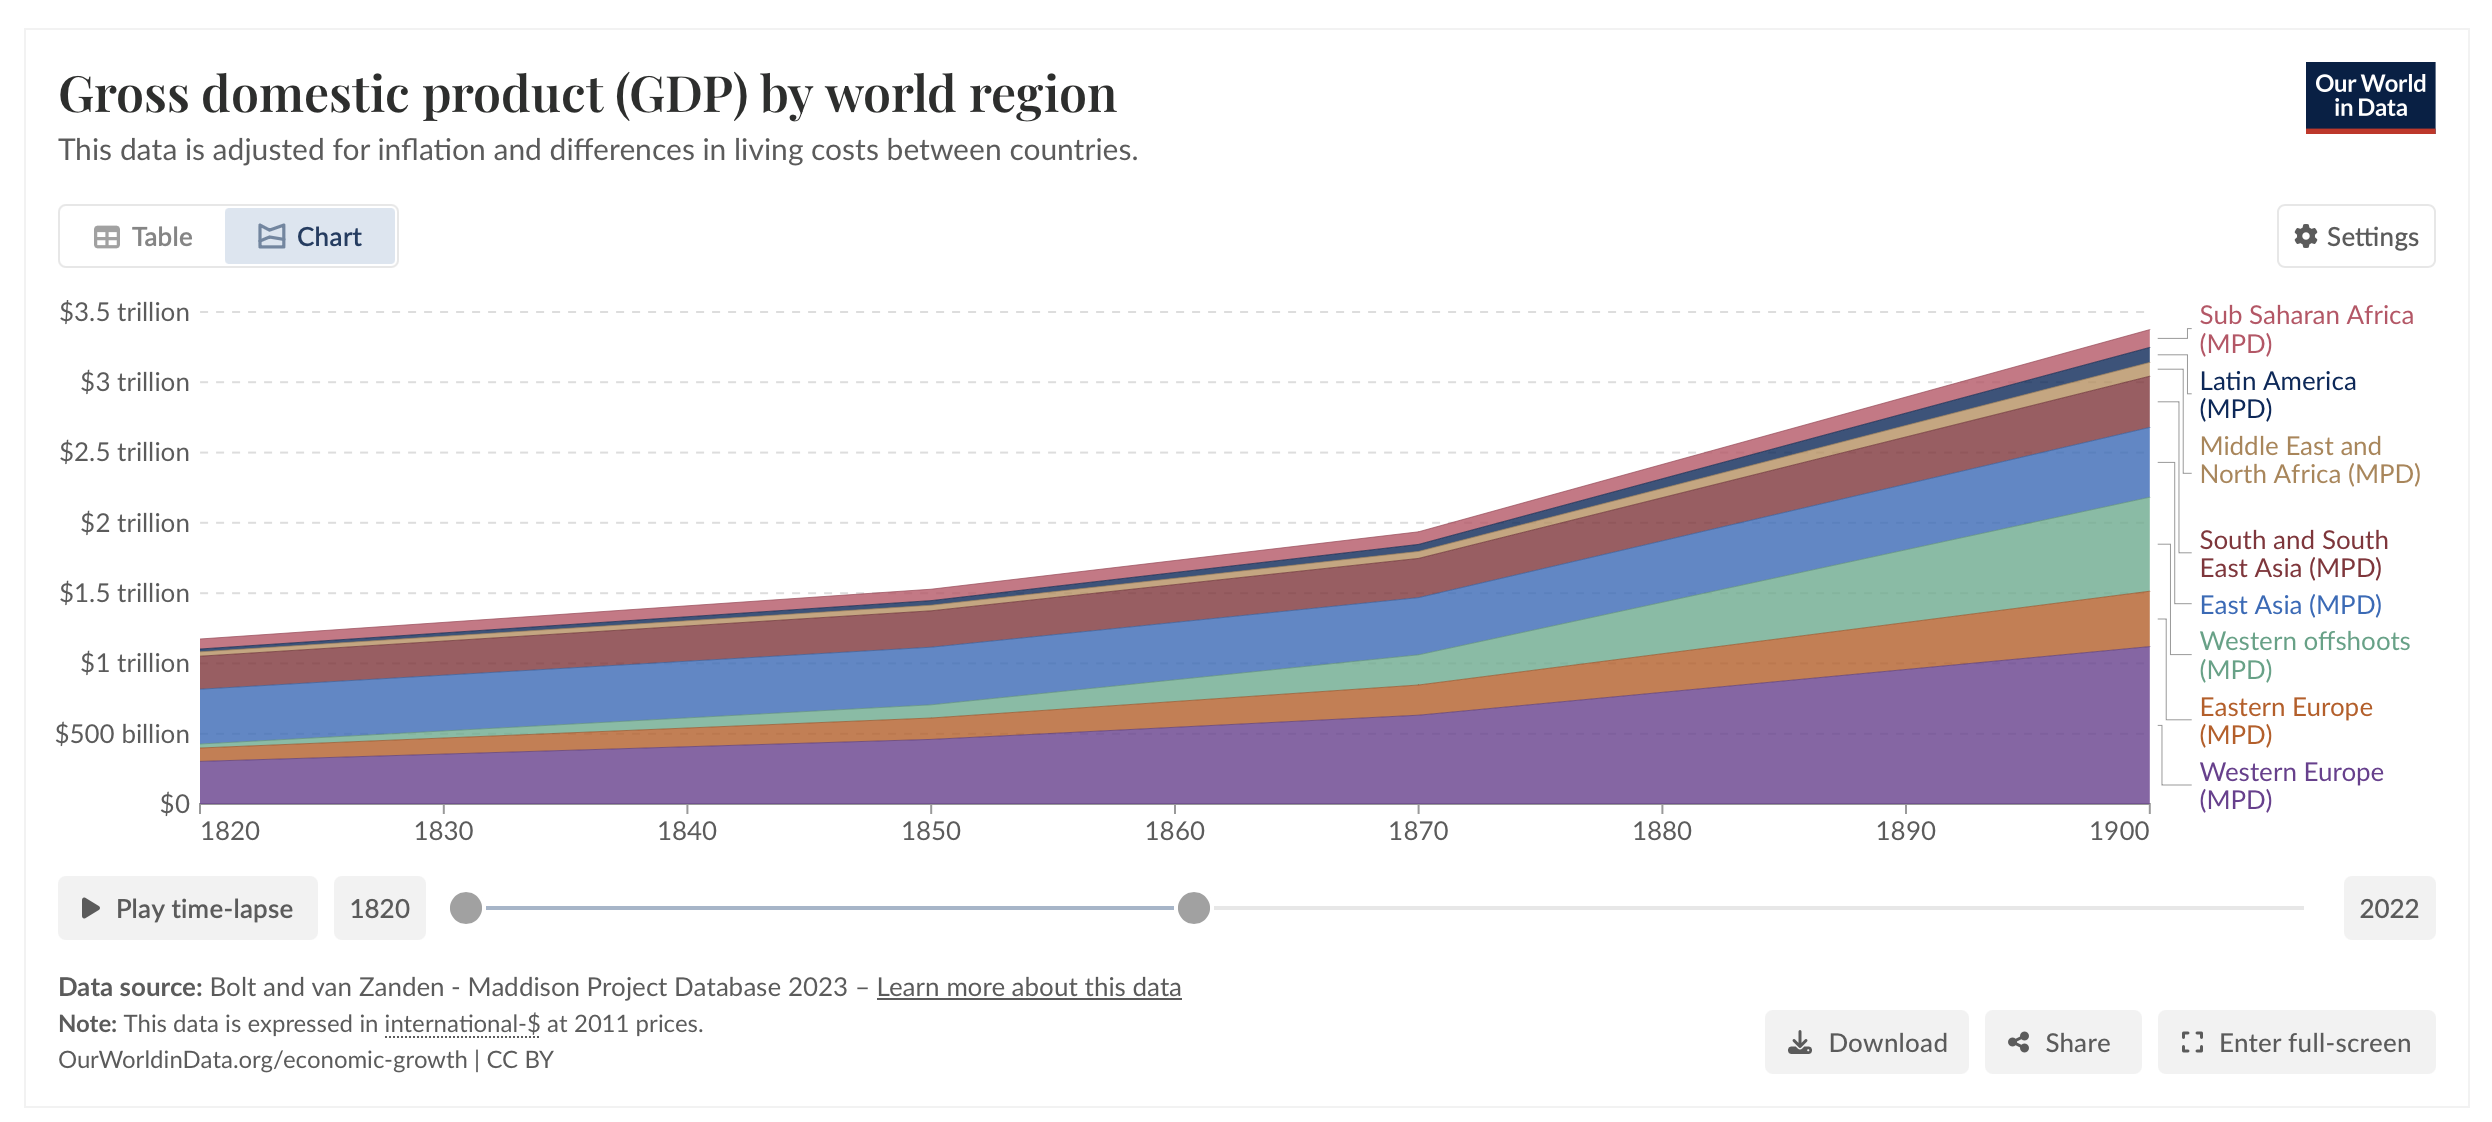
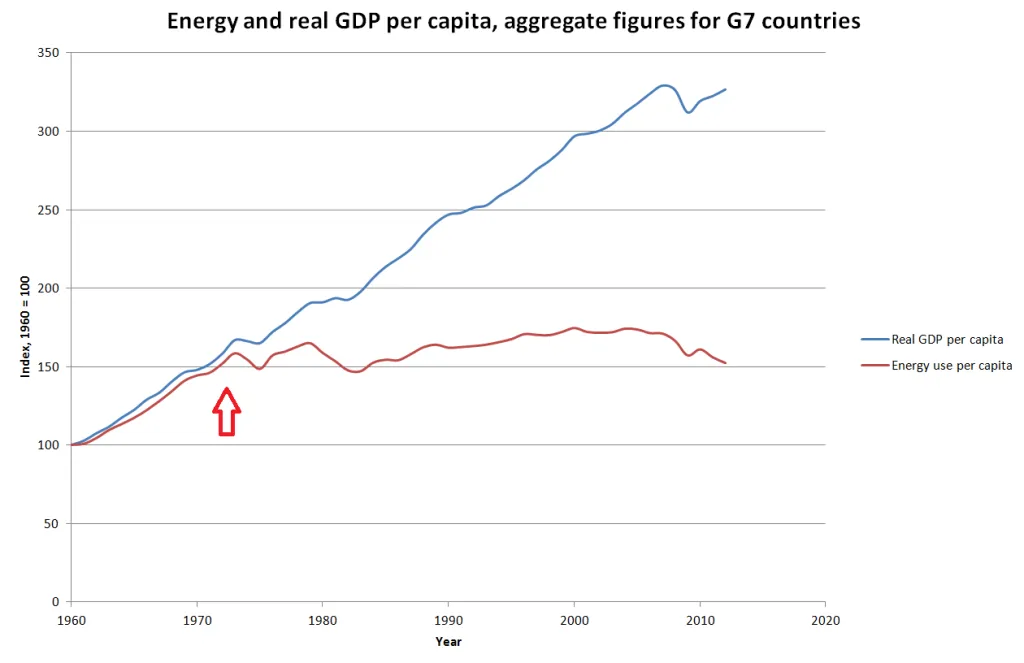
gdp grew at a slow exponential pace after 1973 and energy at a linear pace.
I cannot describe how insane this paper is if true. I and others have notice that things seem to get a little weird in the 70s, but this paper implies it was the cancellation of a 10000 year trend. I don’t have high confidence that the claims in this paper are true, but it provides a strong hint that something odd happened in this period. A correlary would be that if we unblocked the population and energy limiters, the gdp would start growing at its natural quadratic hyperbolic trends. AGI and Fission (100x) and Earth Solar (10000x) and Dyson Sphere (1000000000x) are worth considering in this case.
On the other hand there is no infinite singularity of anything and if you model something as hyperbolic it is going to fall off that trend at some point. Also high R values for energy and GDP with noisy data over nine thousand years is not necessarily impressive when it rounds to zero compared to later values
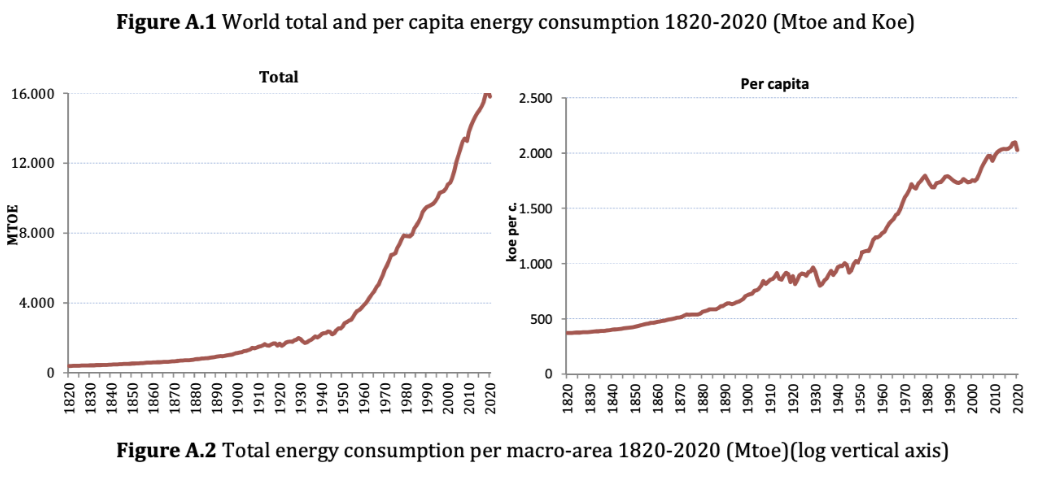
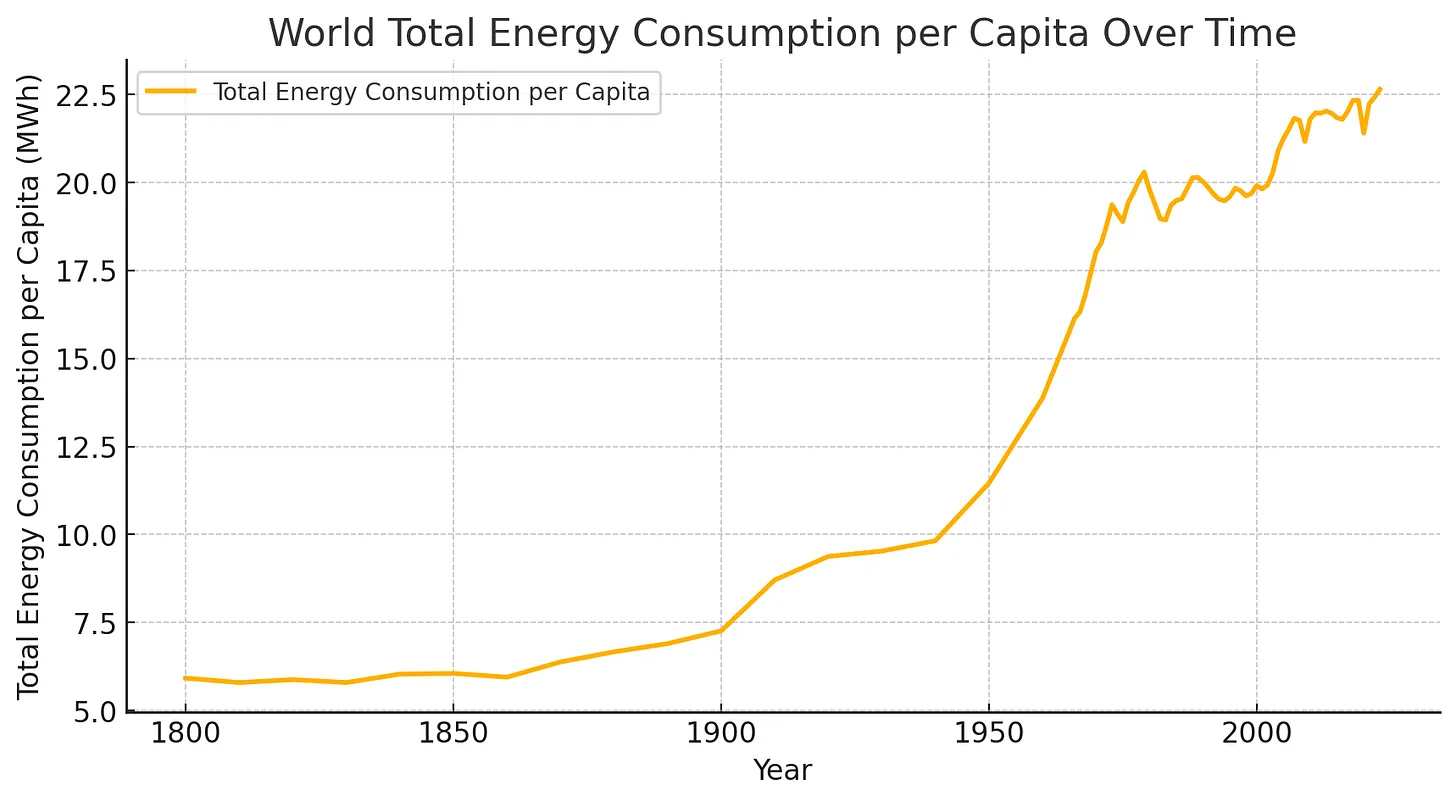
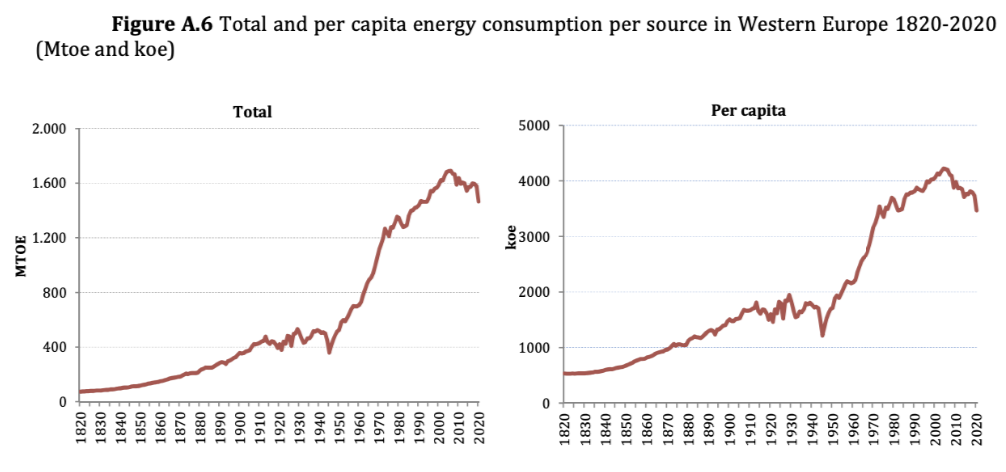
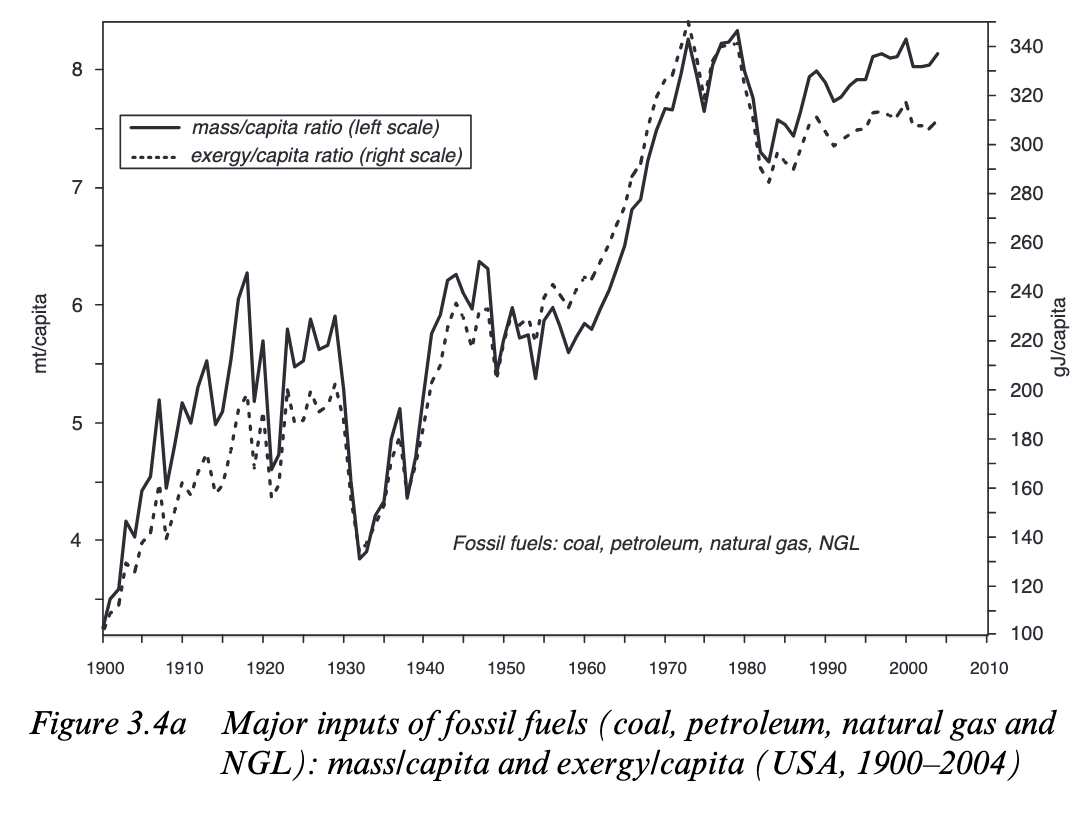
That 1973 oil stagnation coincides with a broader stagnation in energy use per capita the same year.
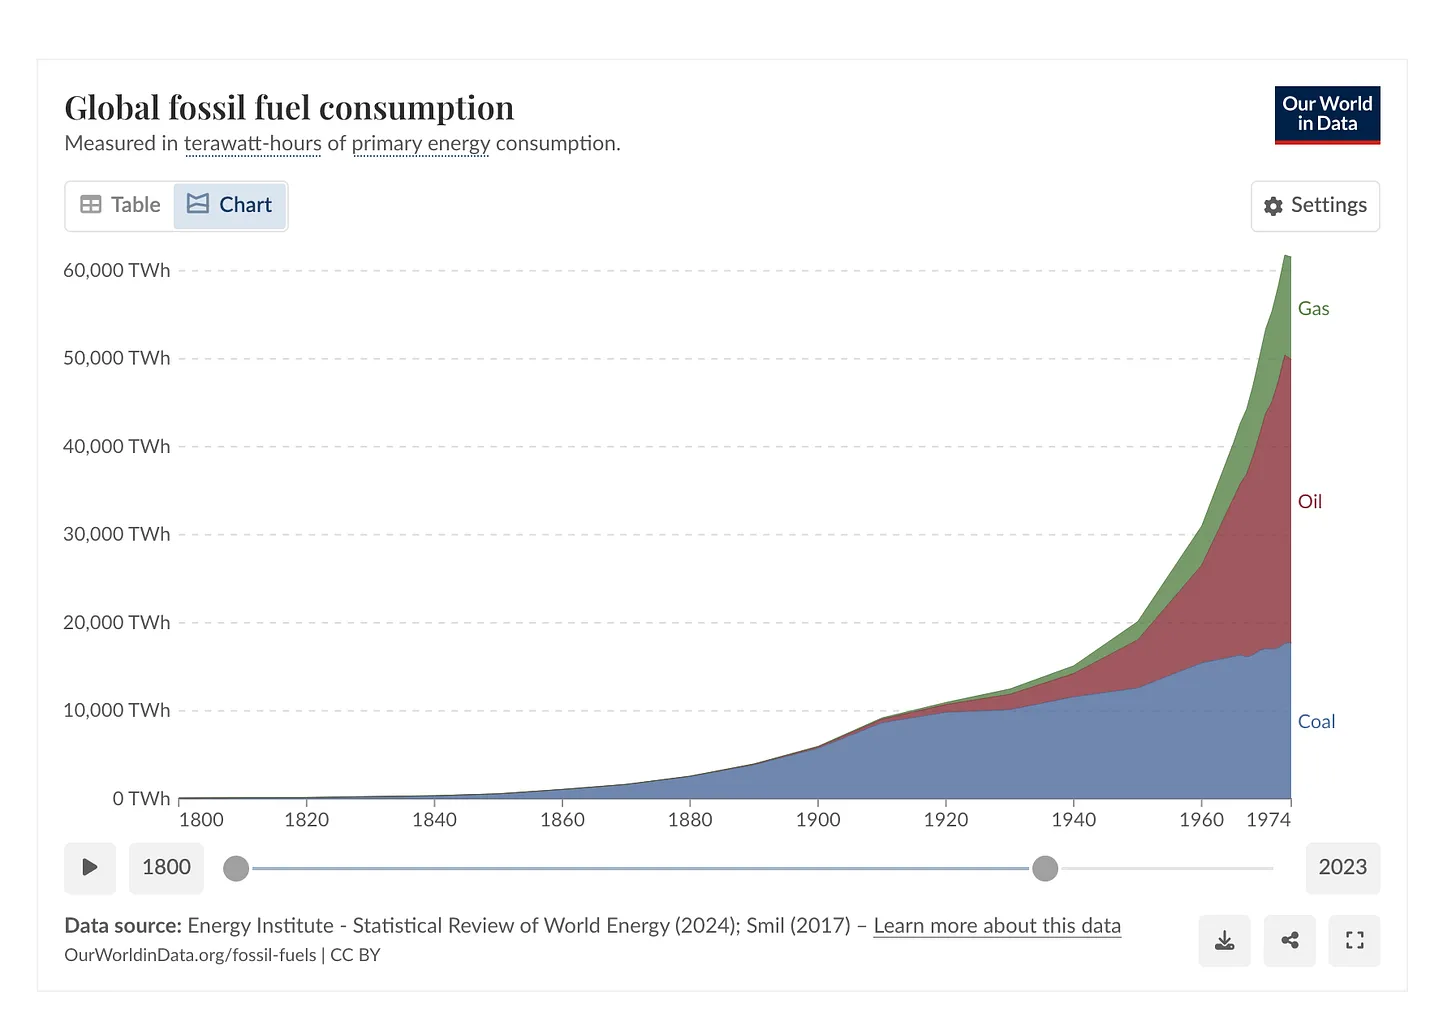
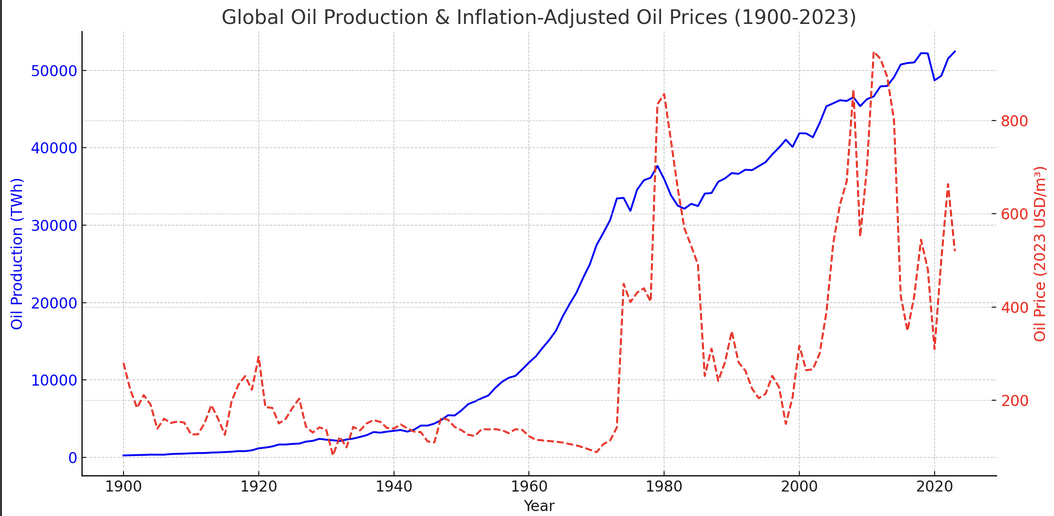
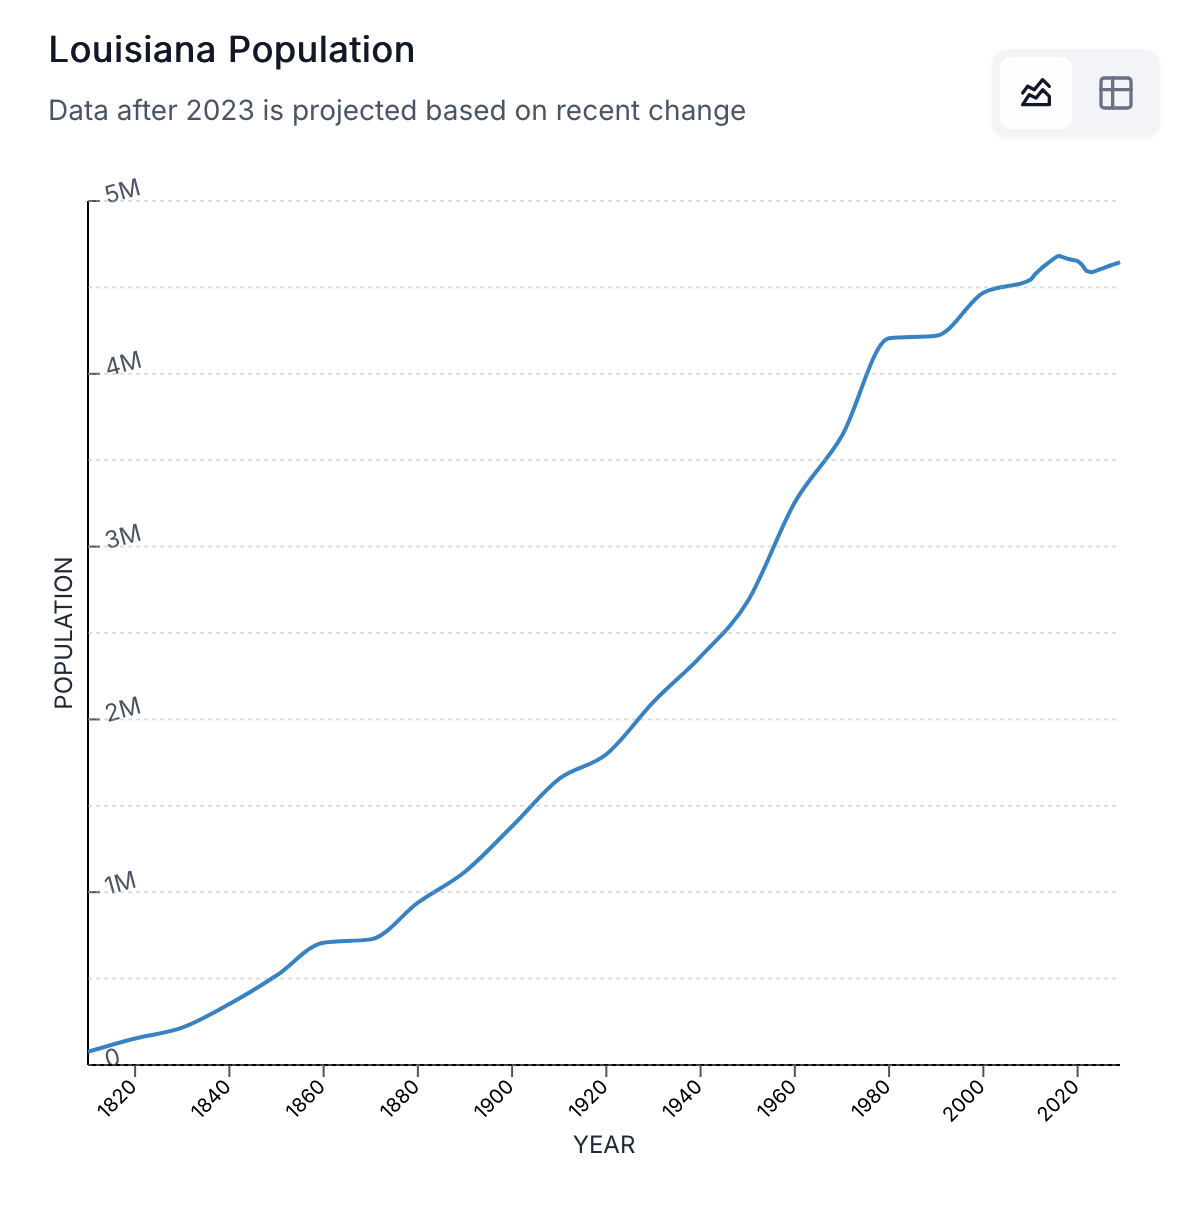
Look at the trajectory of the world pre 1973. And post 1973
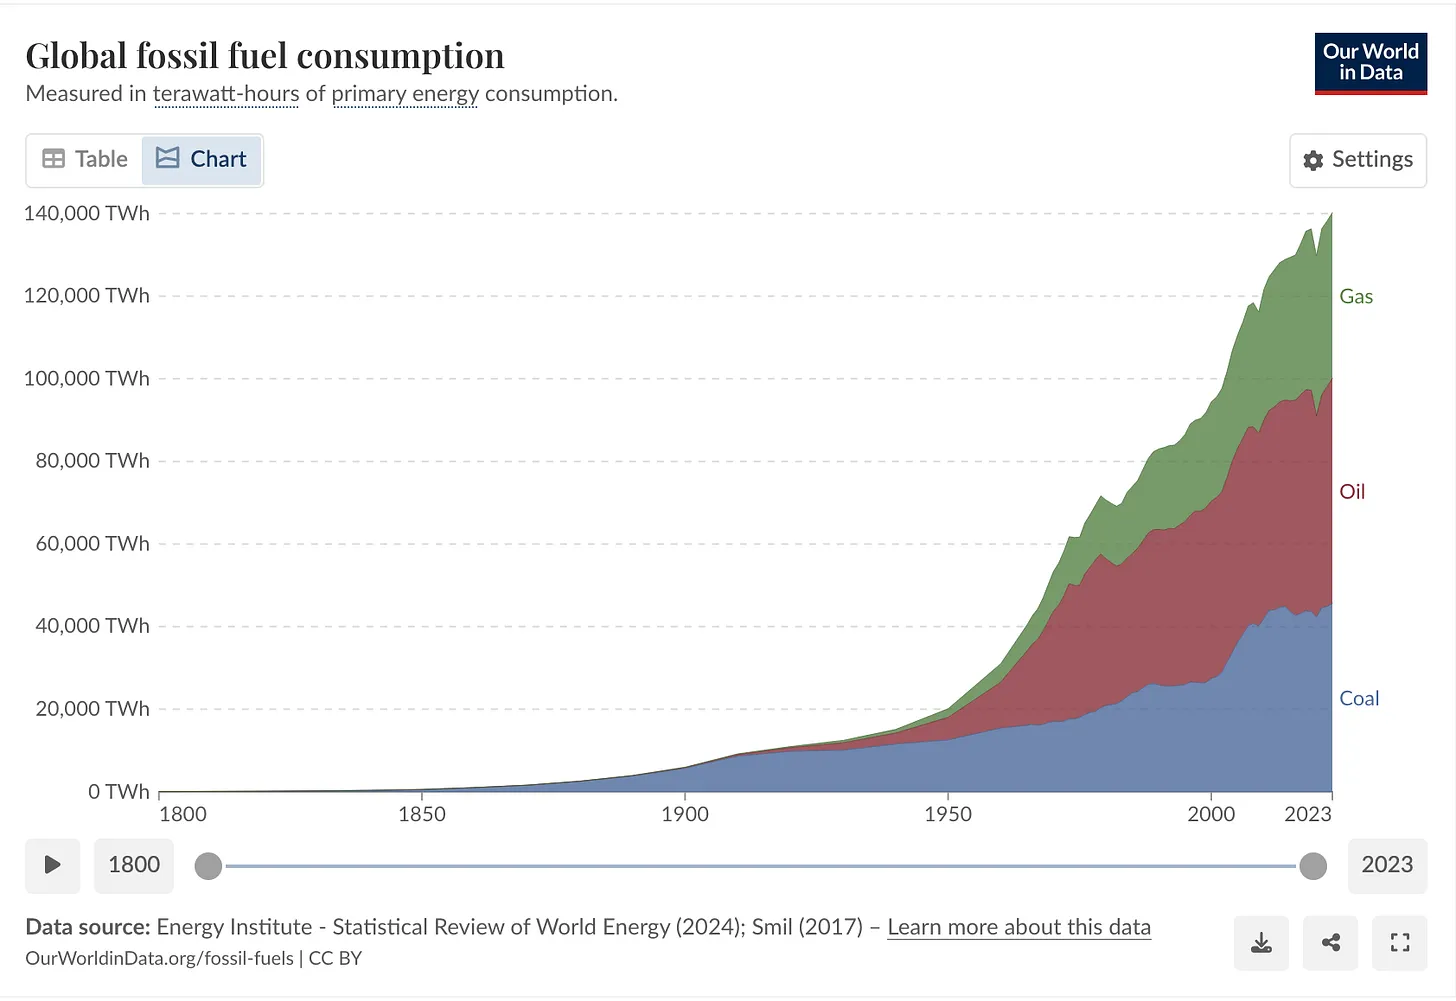
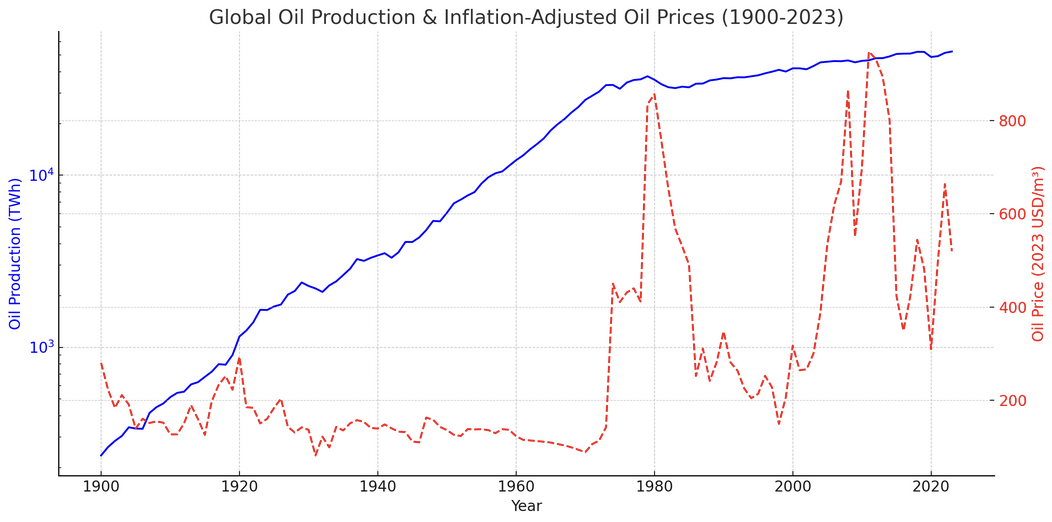
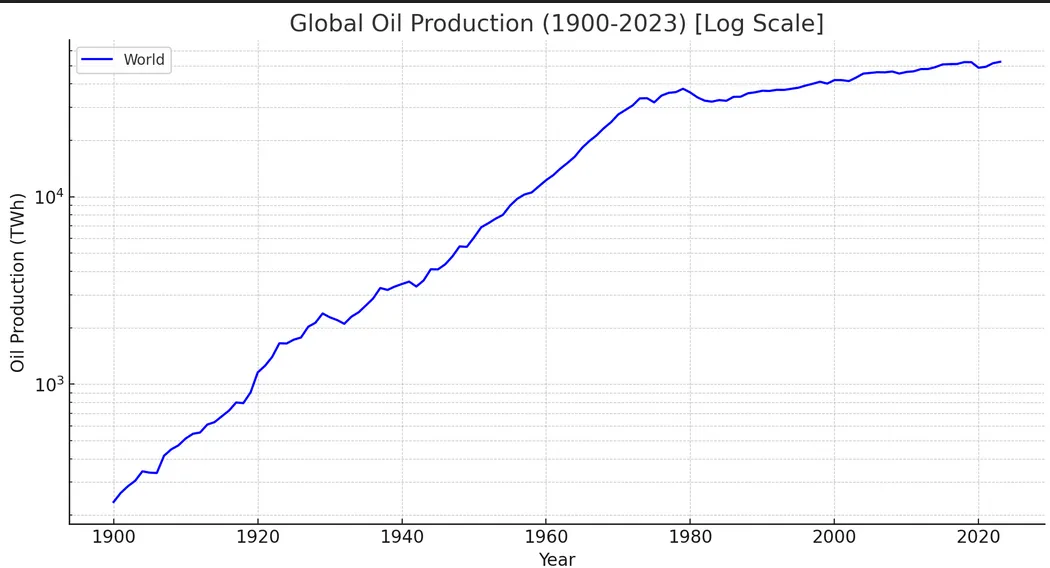
These obviously look very different. I wanted to see how different, so I plotted oil production on a log plot and got a shocking result.
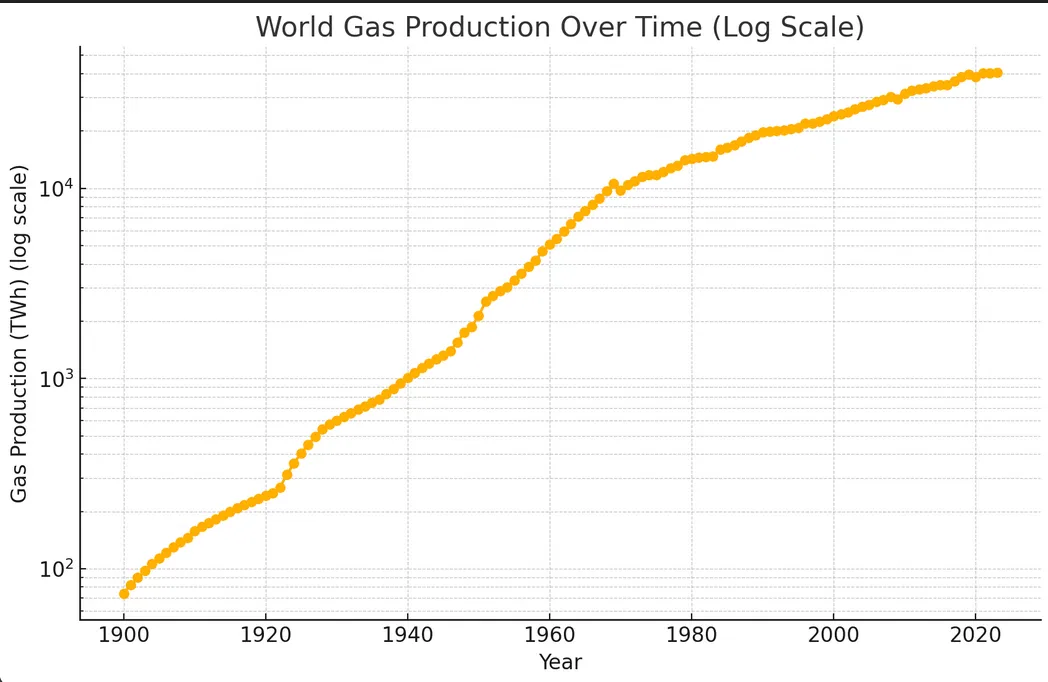
Gas is similar but not as dramatic
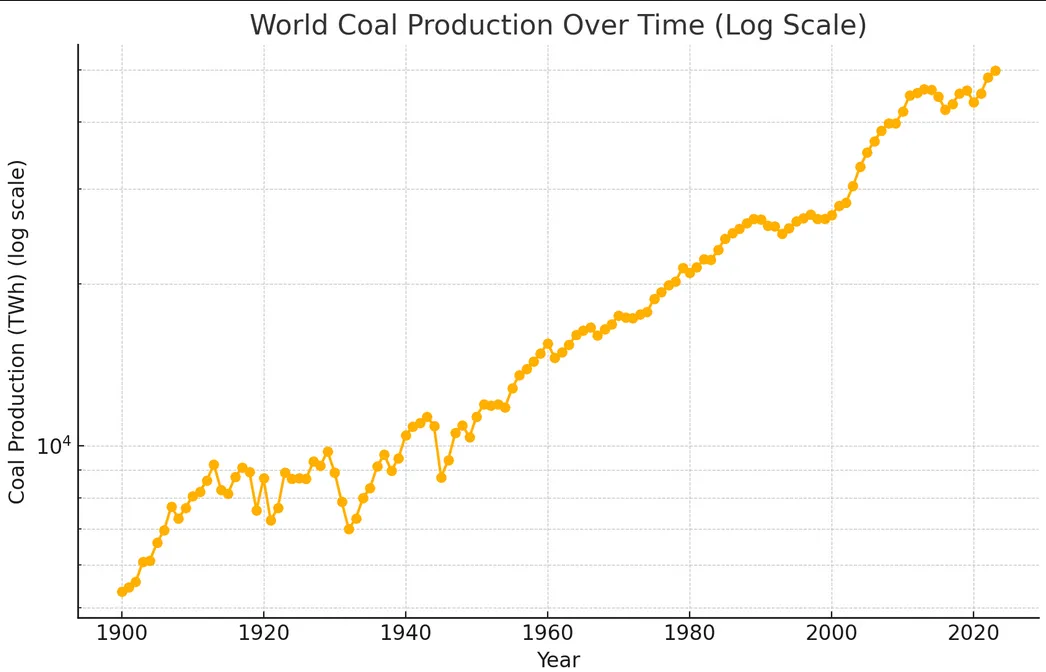
Coal shows no similar slowdown
Oil production increases basically monotonically until 1973, when it rapidly slows, this is a dramatic departure!
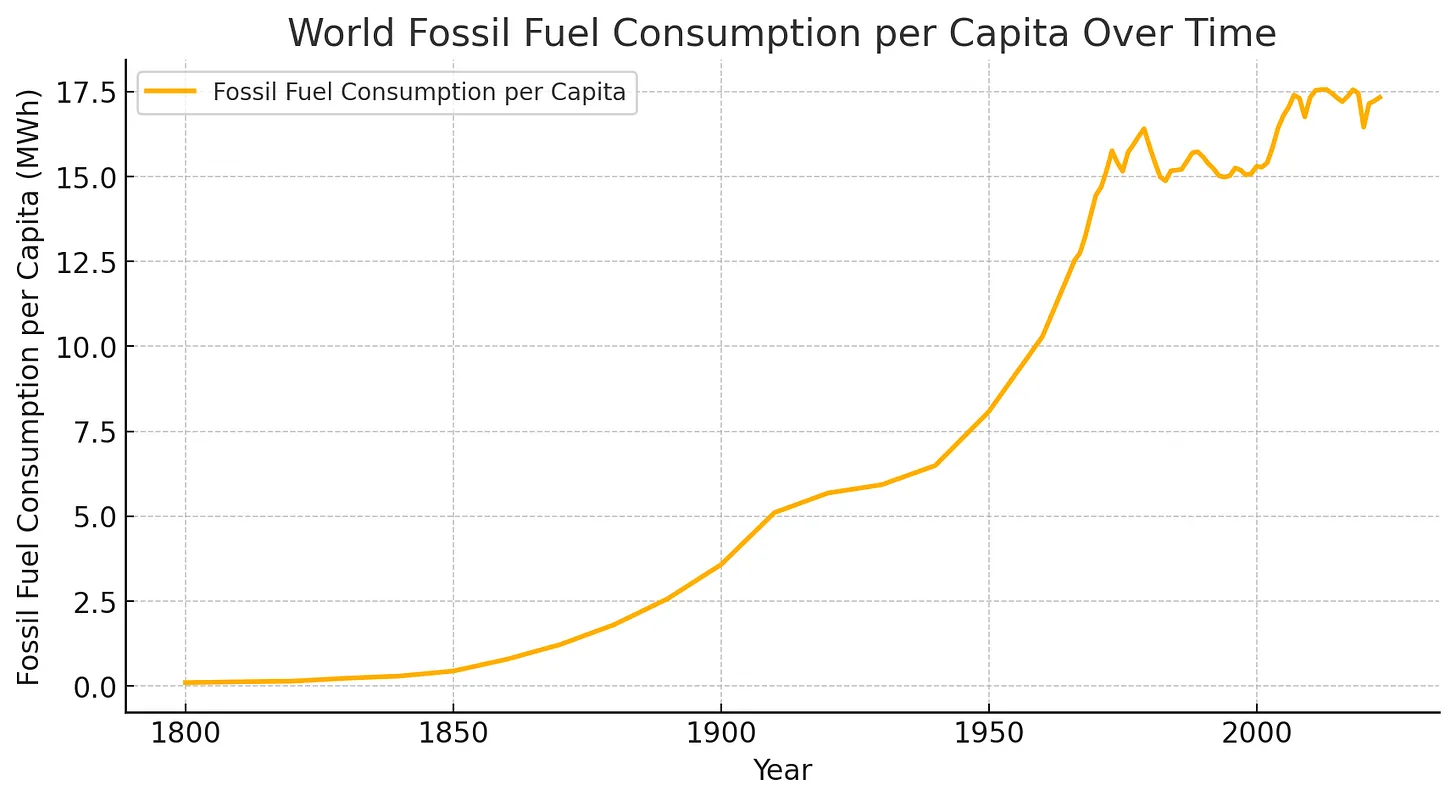
Per capita, it pretty much completely flatlines
True for all energy, not just fossil fuels. Fossil fuels ~= energy post 1900.
The energy story can be shown in three periods:
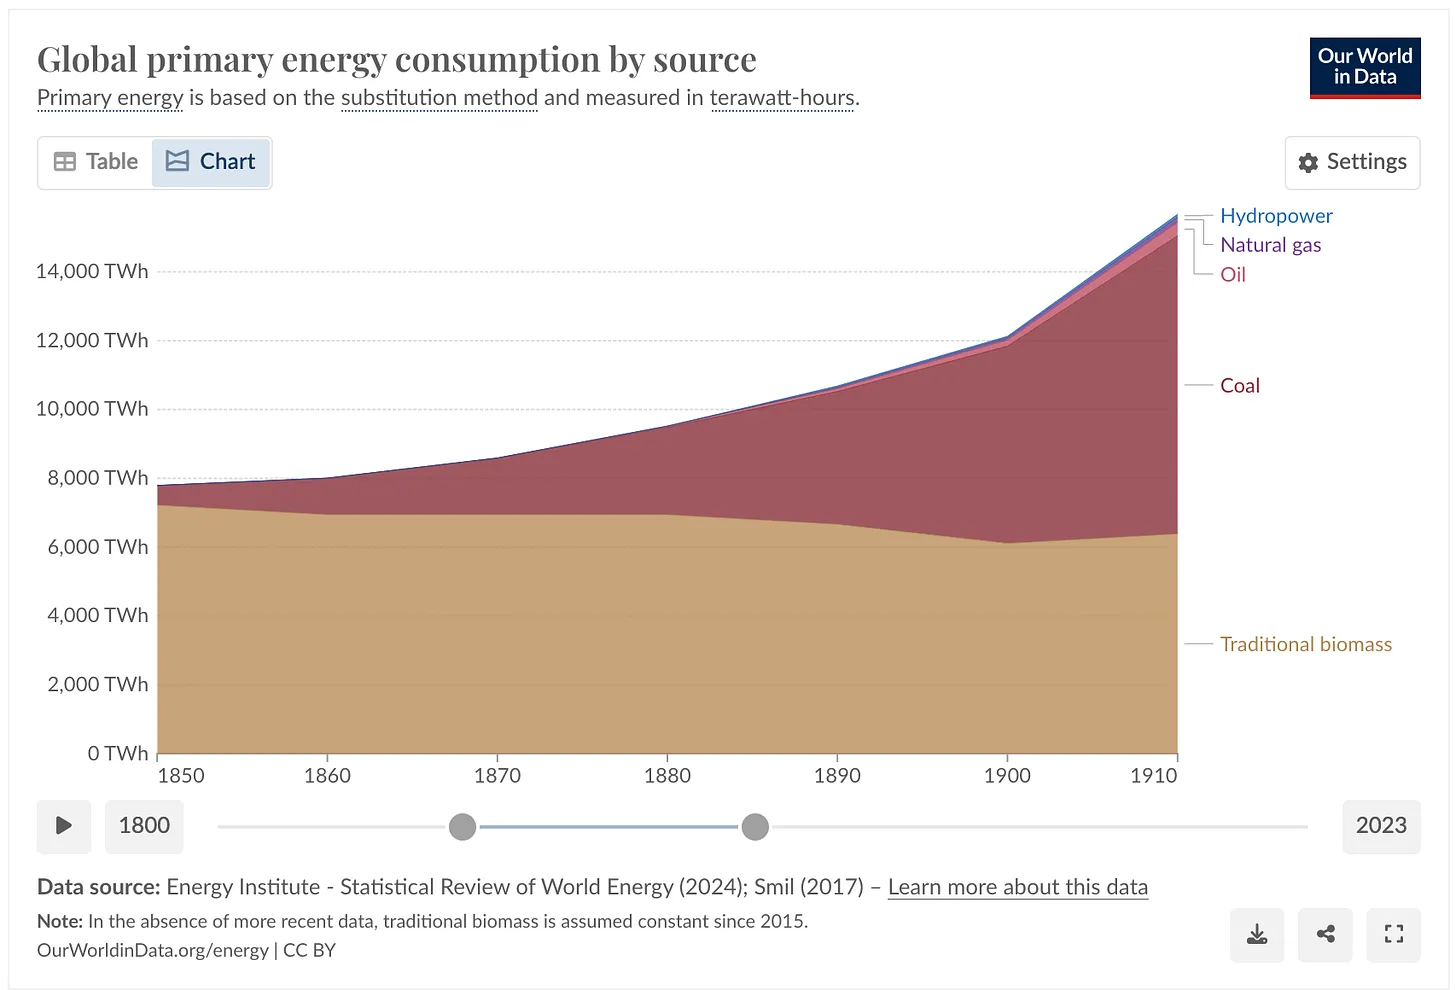
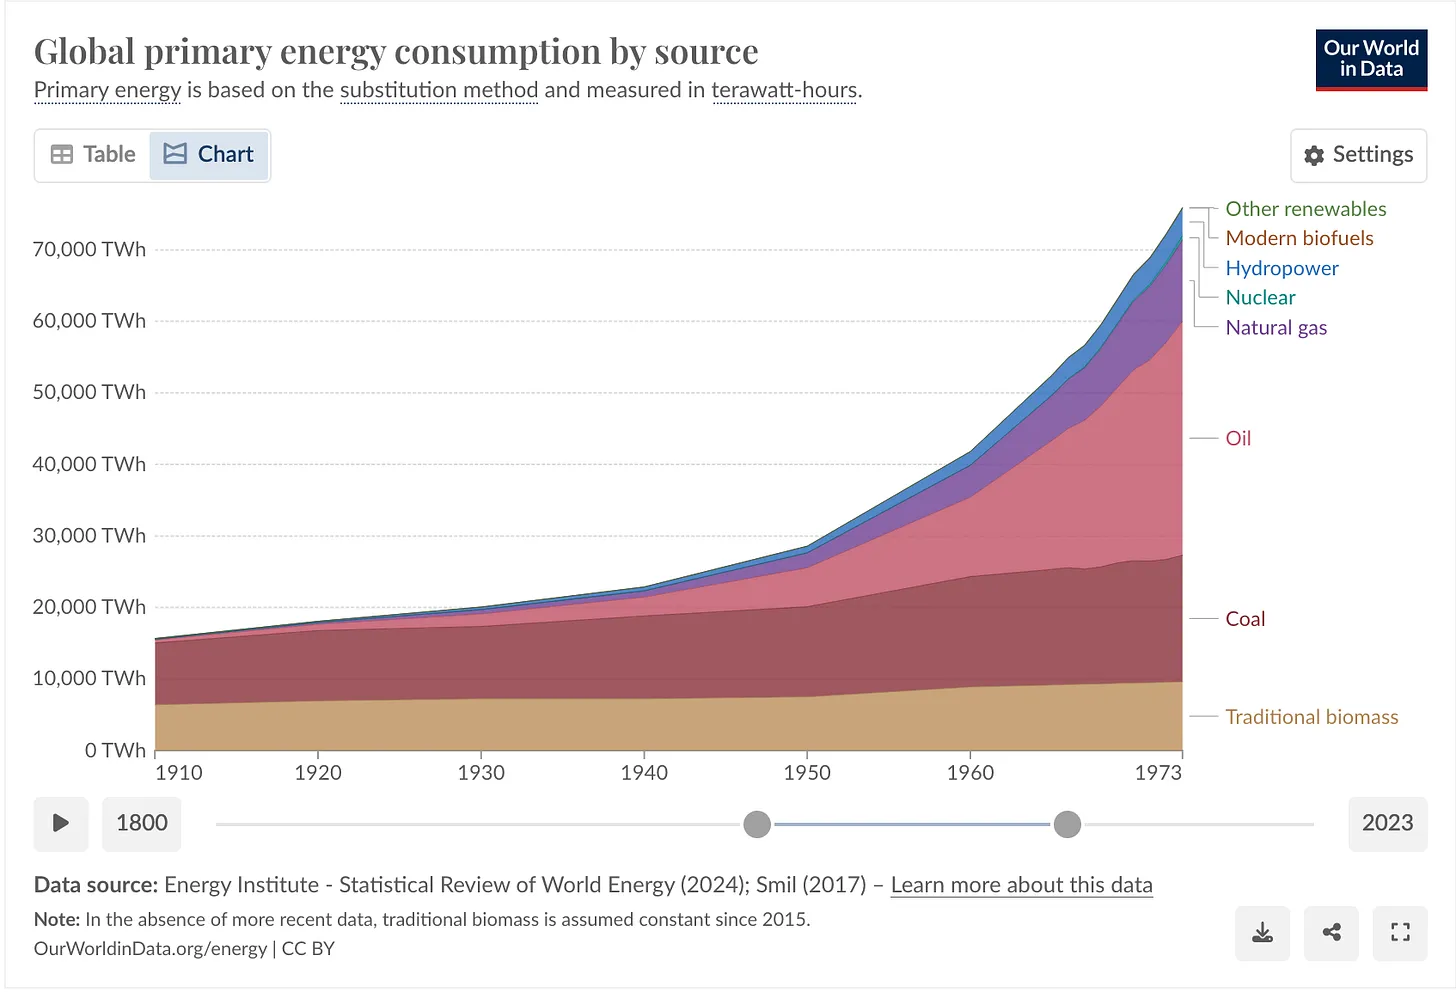

A rough story of this per capita graph. There is an initial coal exponential coinciding with the IR in europe and north america, then a stagnation running from WW1 to the end of WW2 (mainly because europe accounted for most of the world’s energy use during this time. estimates put it at upwards of 50% with the US around 20%).
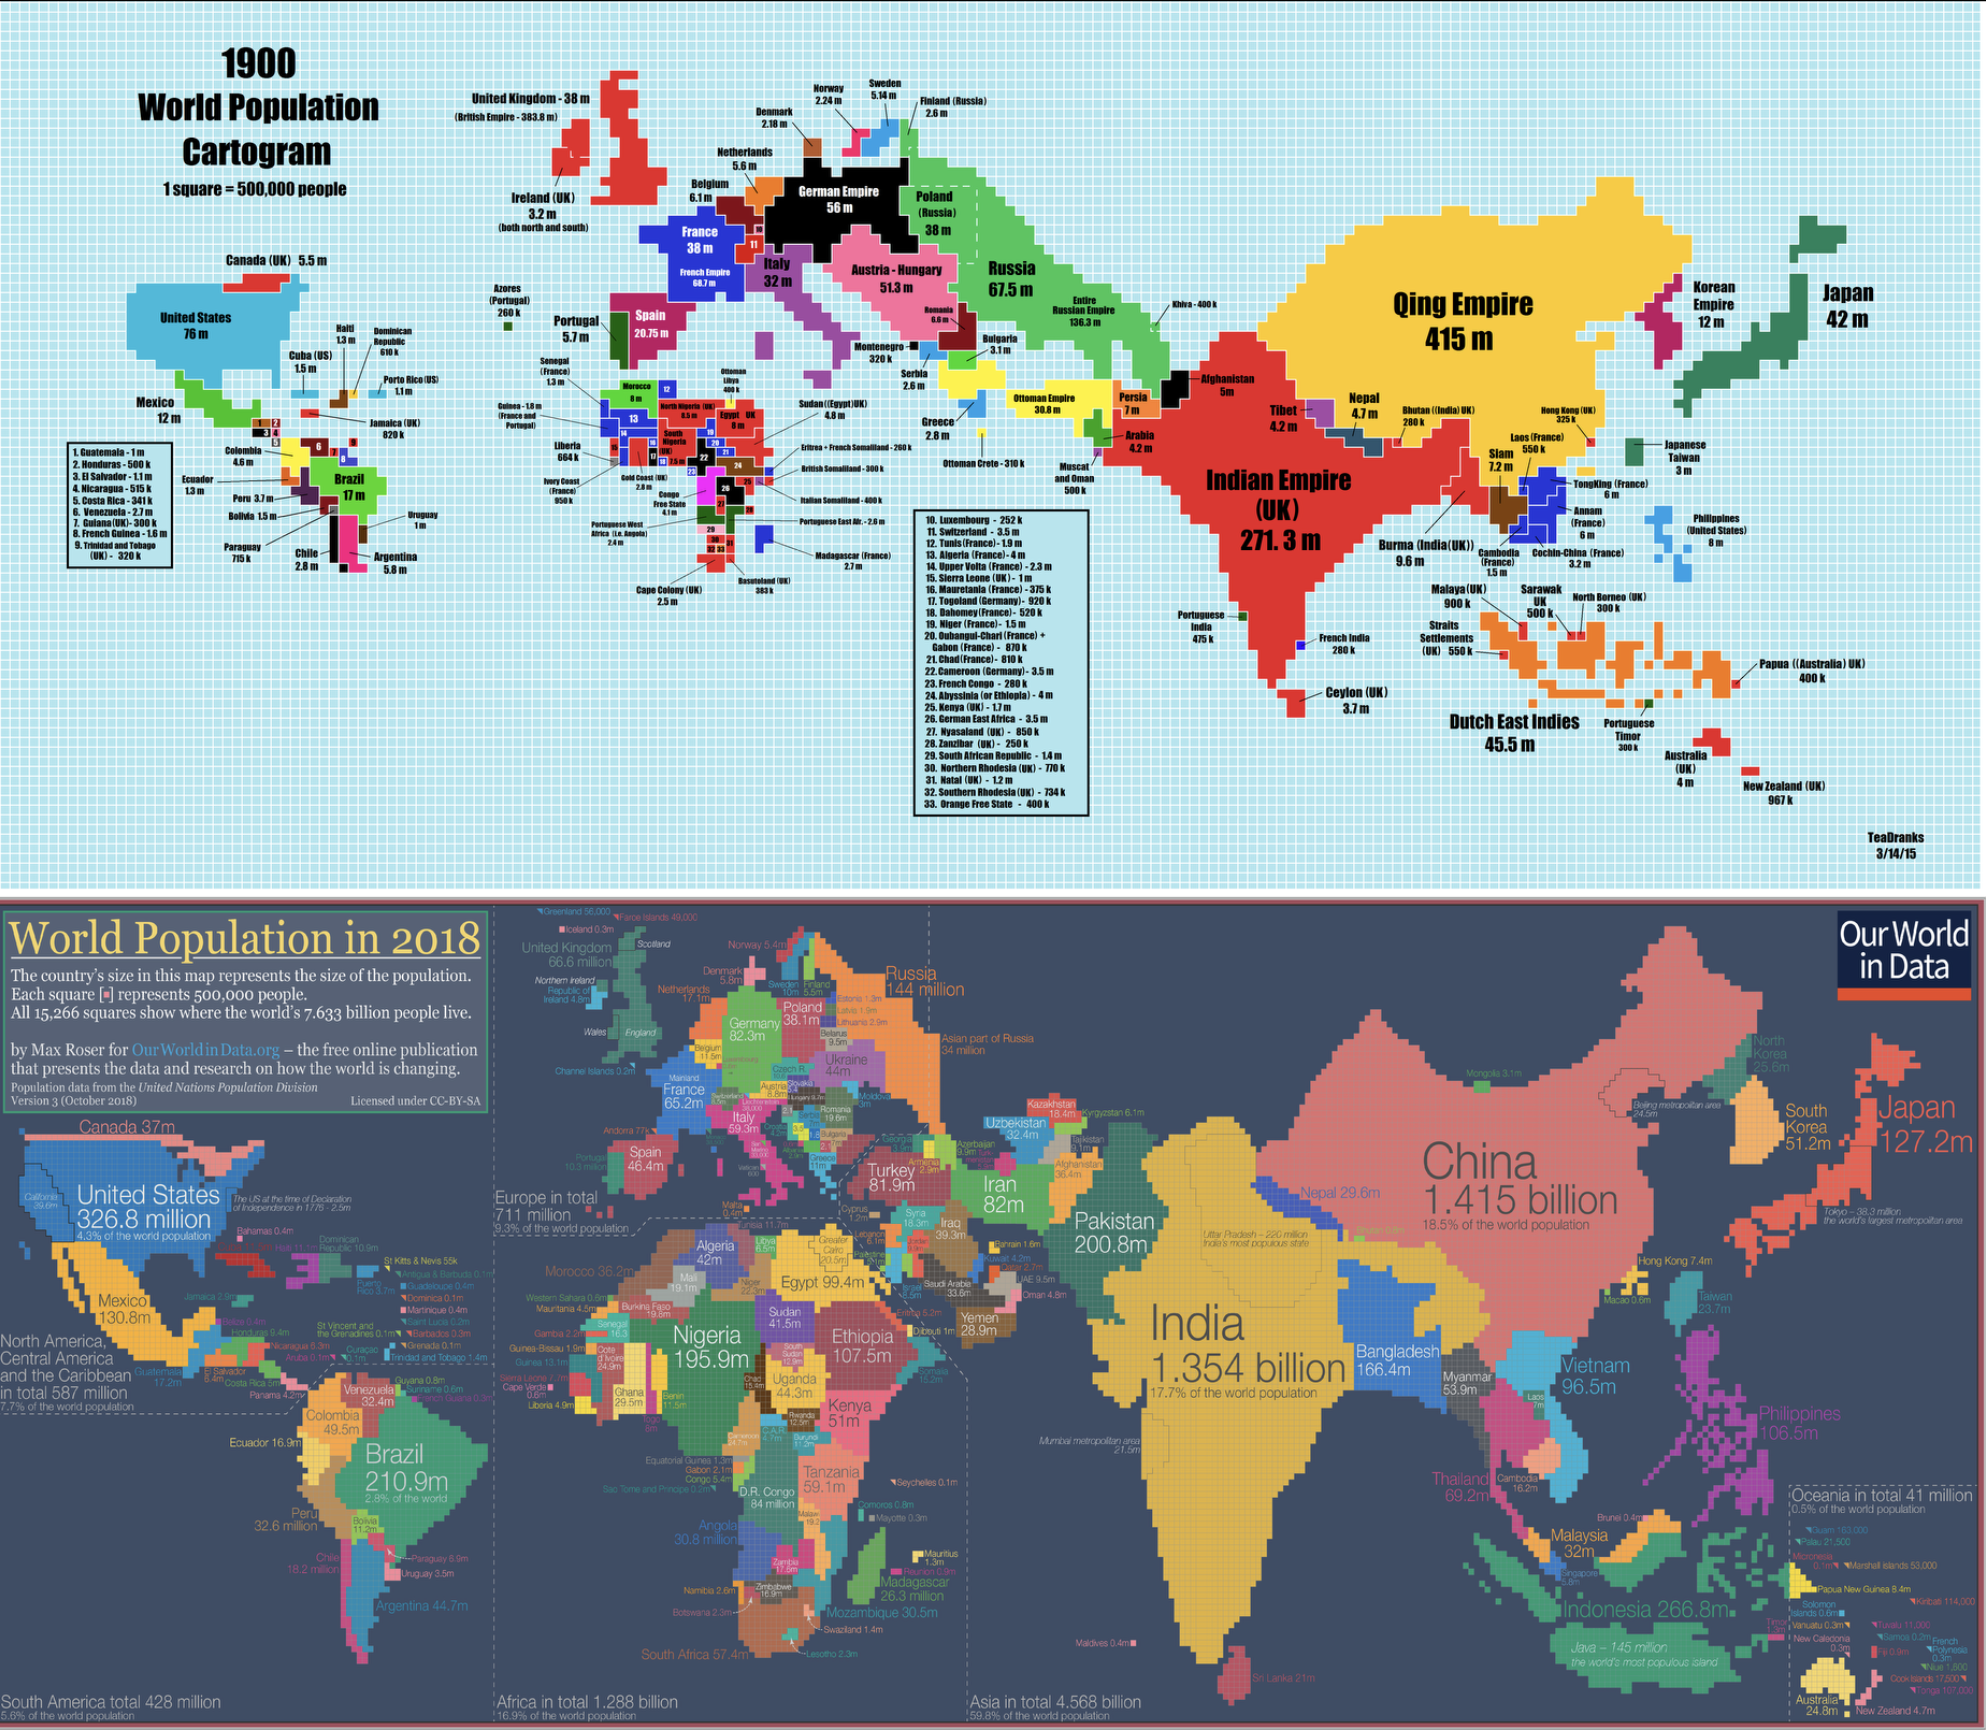
(some context for why what happened in europe translated into what happened for the world. Europe was the world economy at this time. It wasn’t tiny like it is today. Europe’s population was much larger than Africa in 1900. It was a much larger share than it is now, with a quarter of world population.)
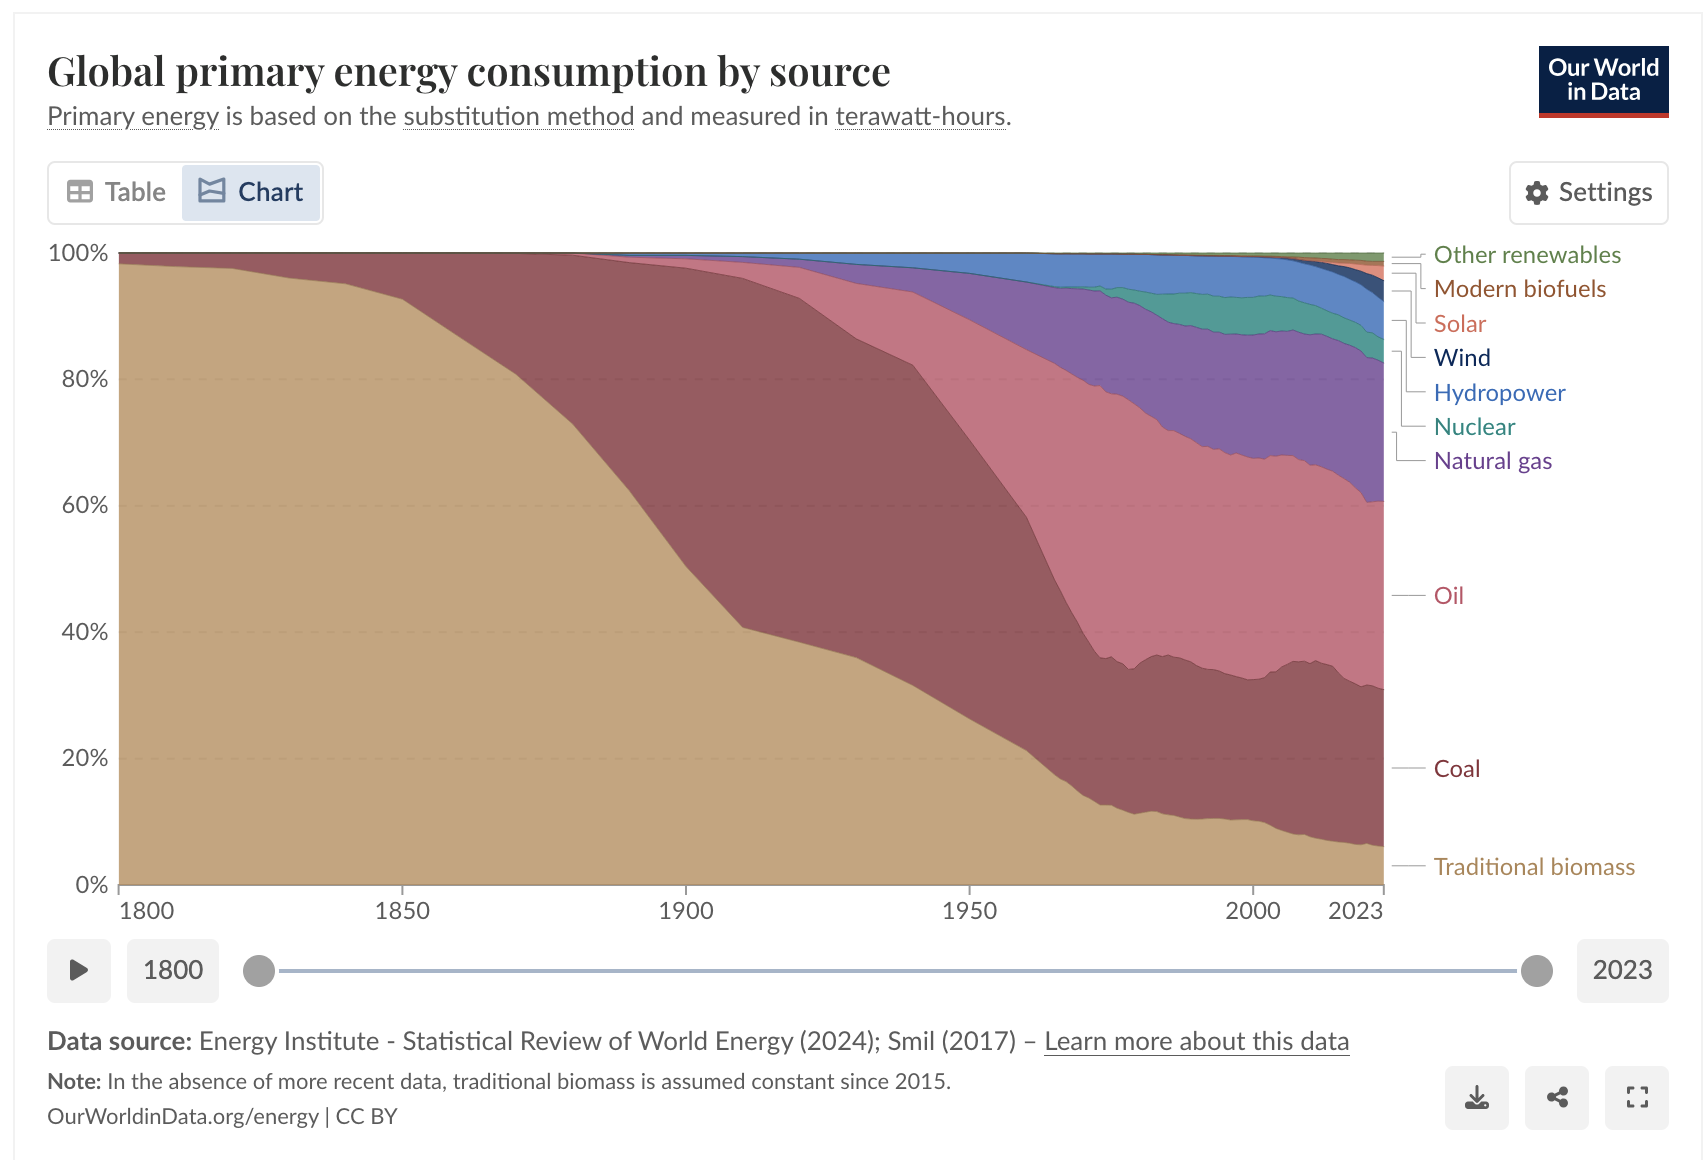
See 1910 as peak coal percentage
This stagnation can alternatively just be seen as the early stages of an exponential under the oil/gas regime.
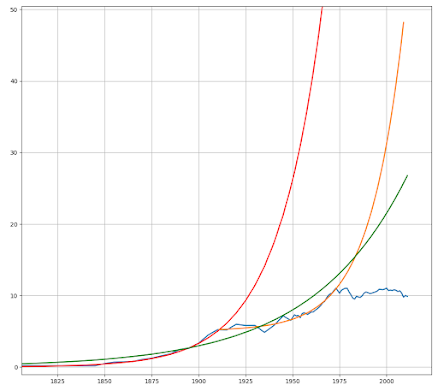
J storrs hall, the first person to identify this, breaks down his famous henry adams curve into two separate exponentials.
https://wimflyc.blogspot.com/2021/01/the-henry-adams-curve-closer-look.html
The oil exponential continued at a very high growth rate until 1973, when it plateaued. The world stayed in this plateau until the 2000s, when the rise of china drove up the average visibly.
This 1973 stagnation took place across the whole developed world.
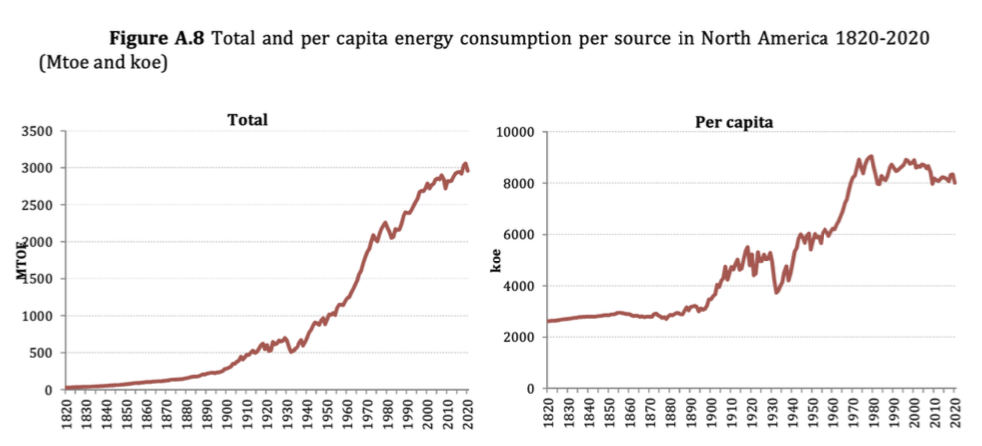
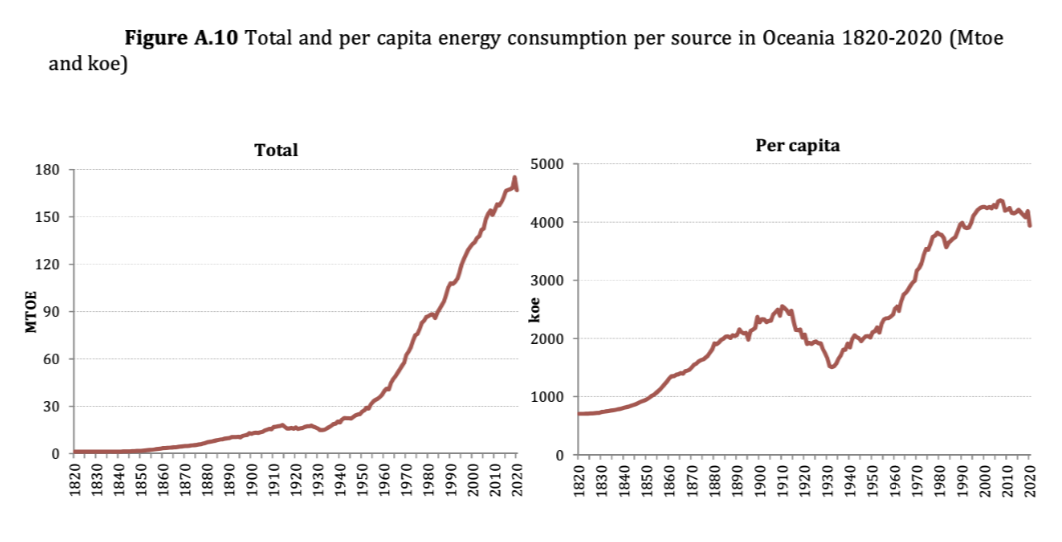
This happened across the developed world, and the world as a whole. (did not touch eastern europe, latam, mideast, asia)
THE SAME YEAR as the 1973 stagnation, TFP fell off. I think this is not a coincidence.
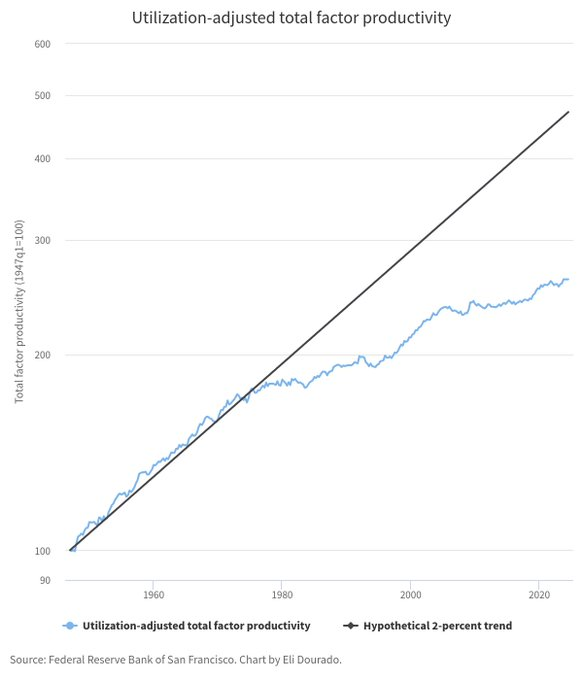
That same year, our long running TFP in the US fell off it’s trend. Note the short lived IT boom gains.
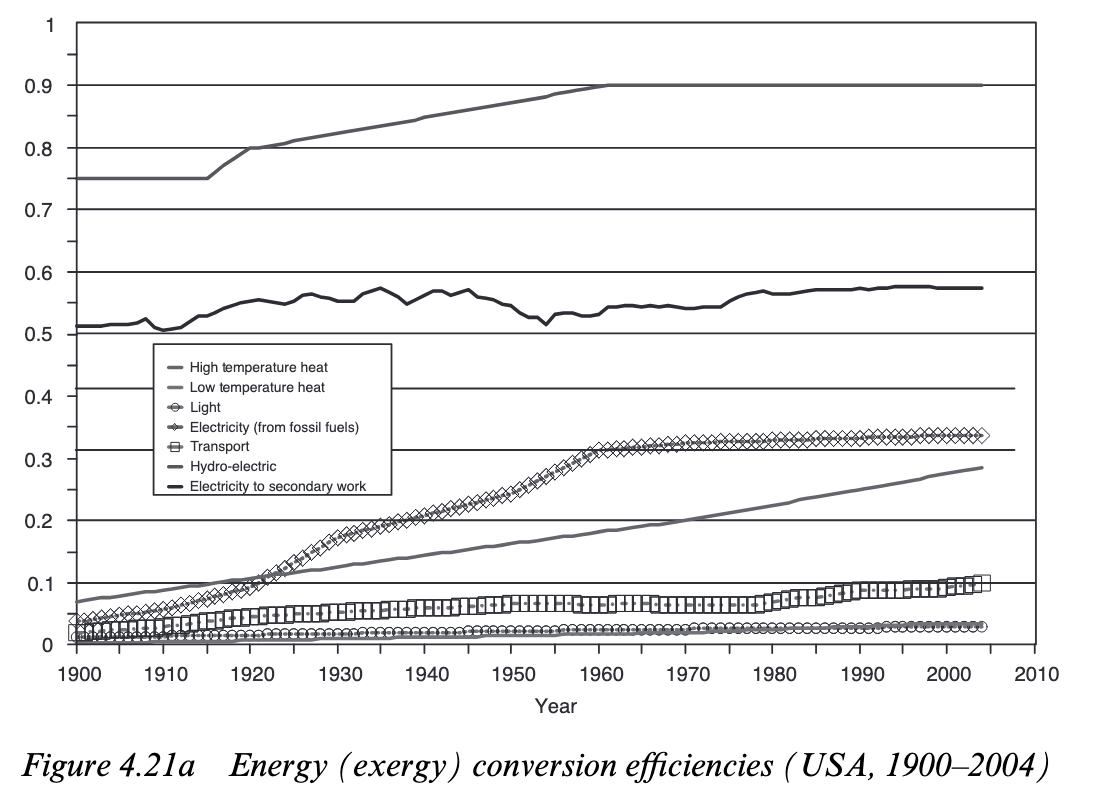
The Economic Engine (Ayres) makes a compelling case that this TFP falloff is deeply related. (TFP is actually conversion efficiency and lower input costs)
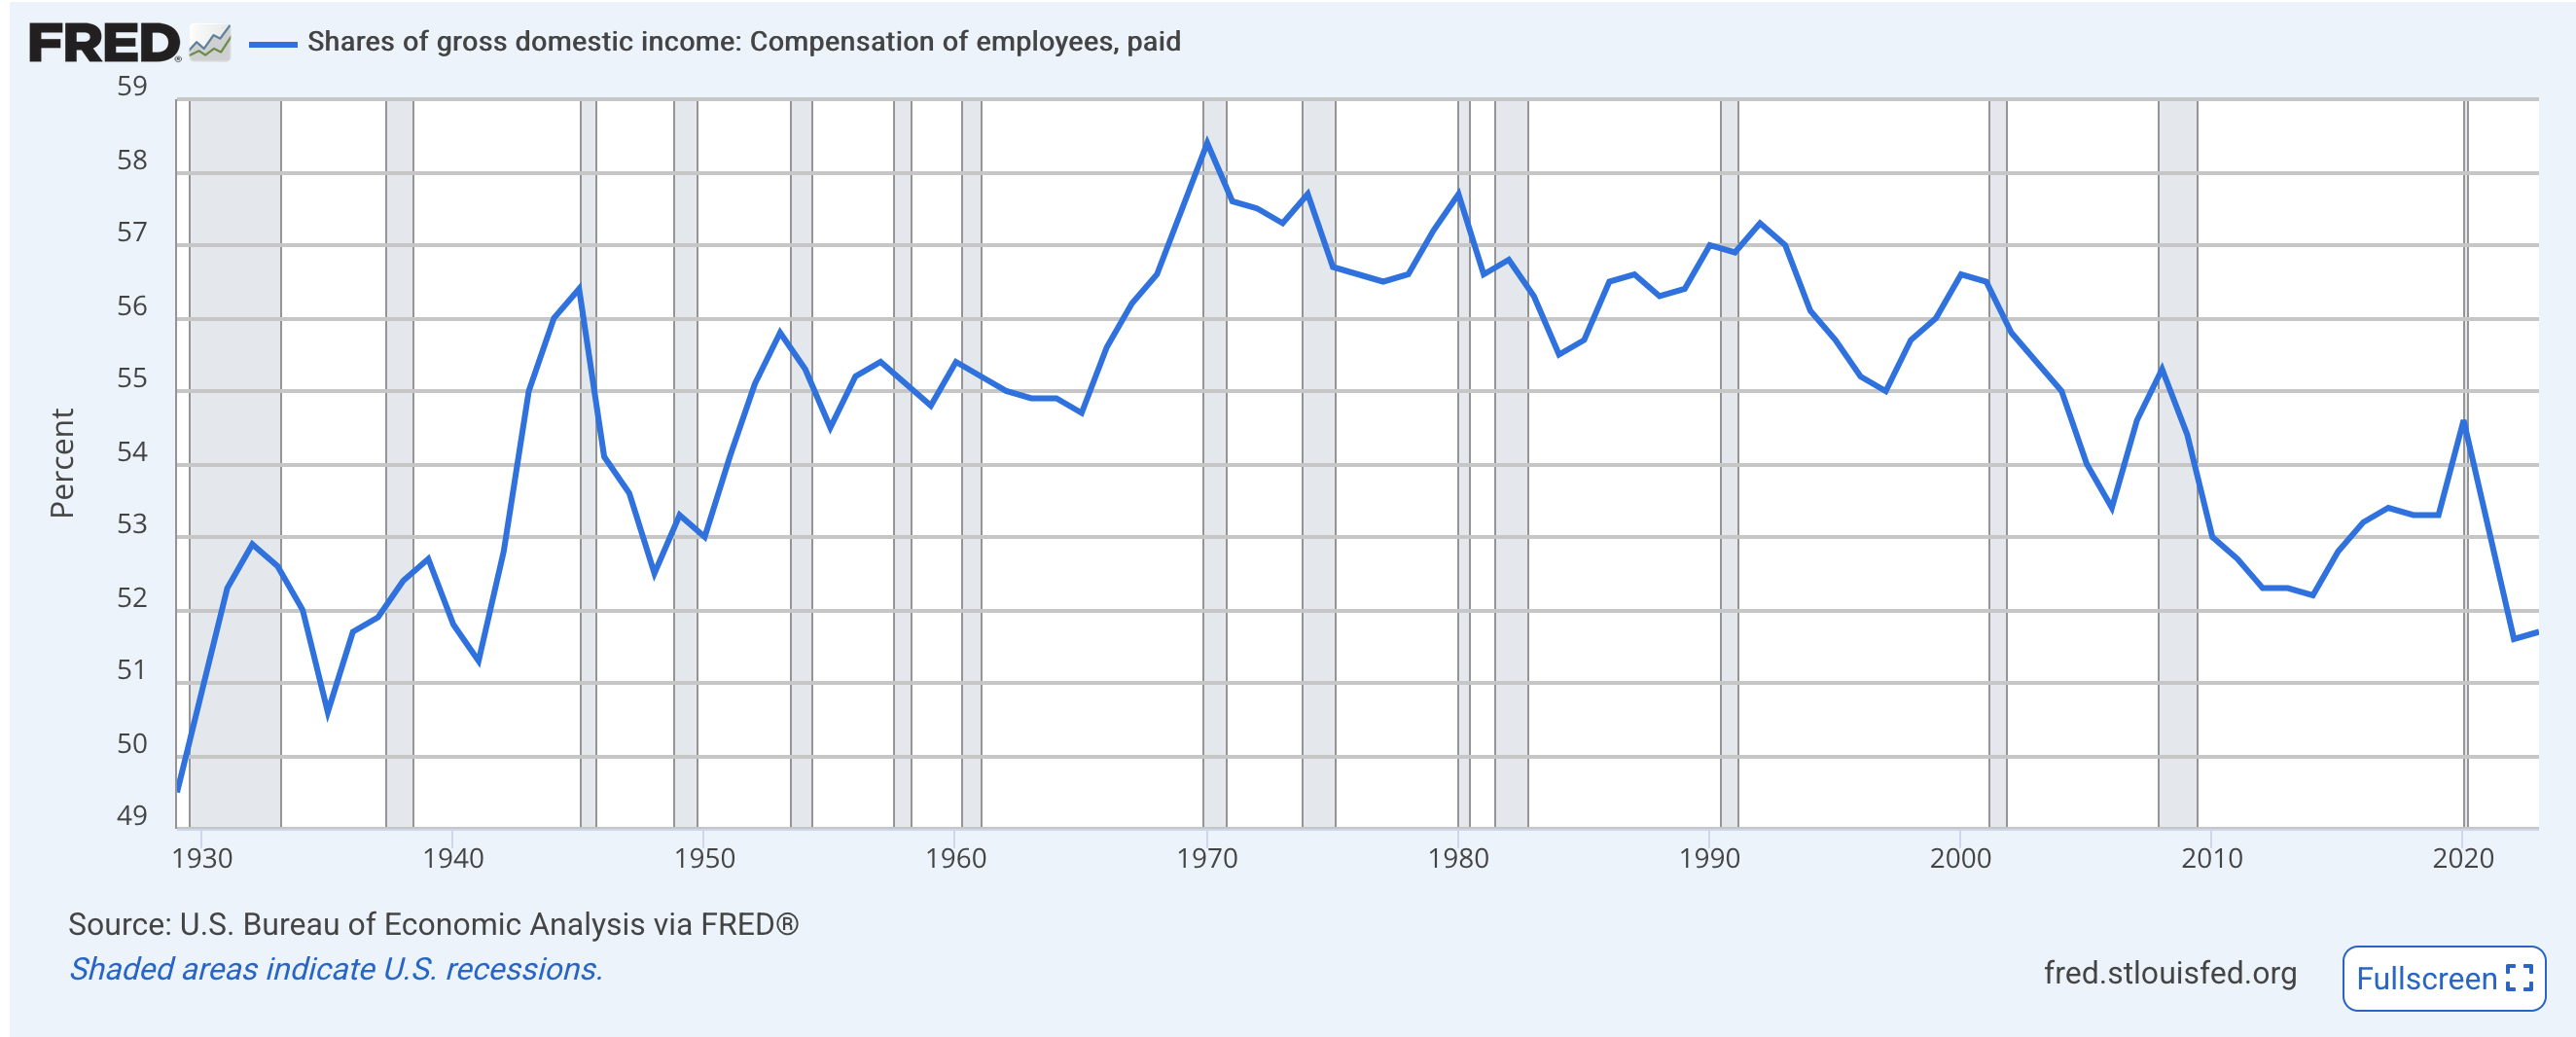
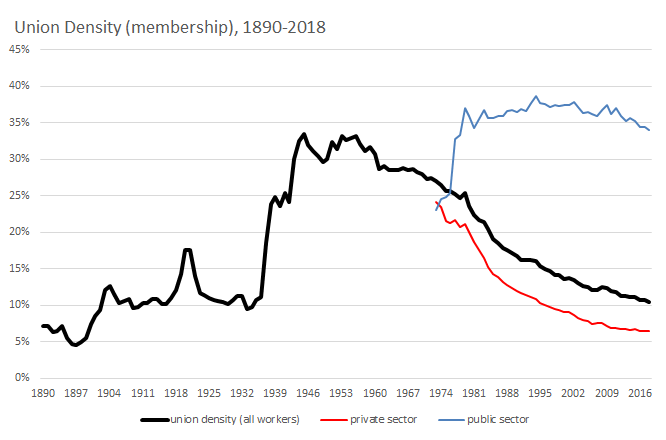
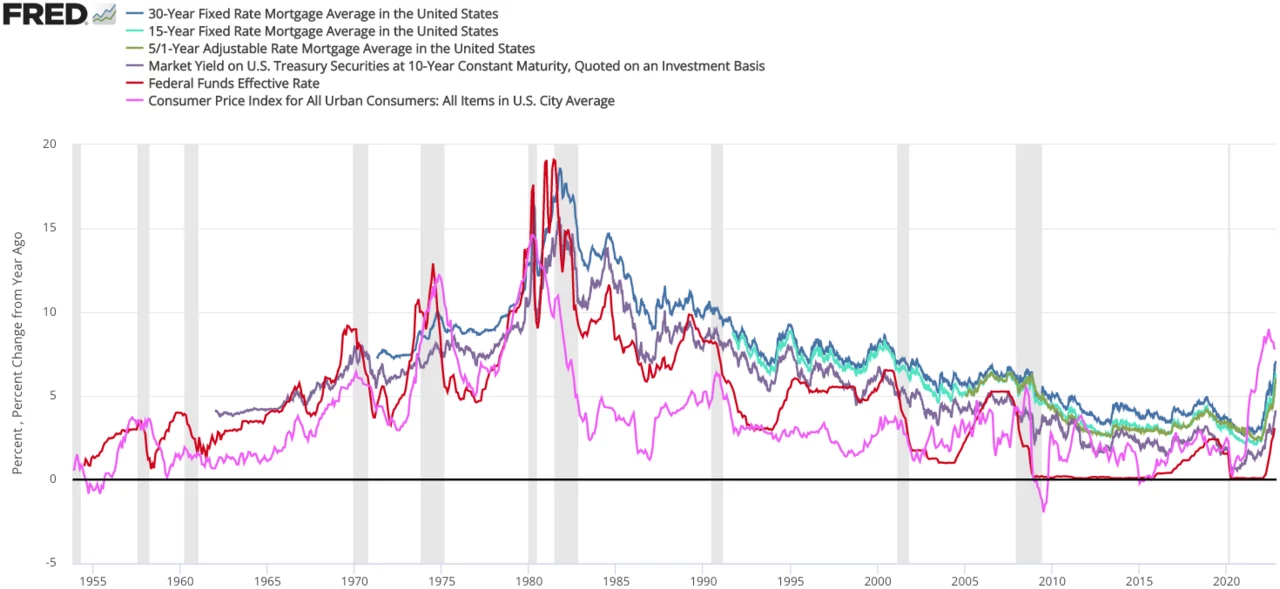
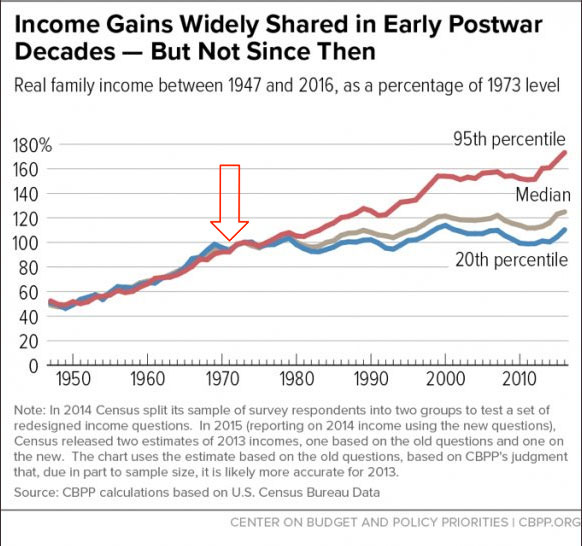
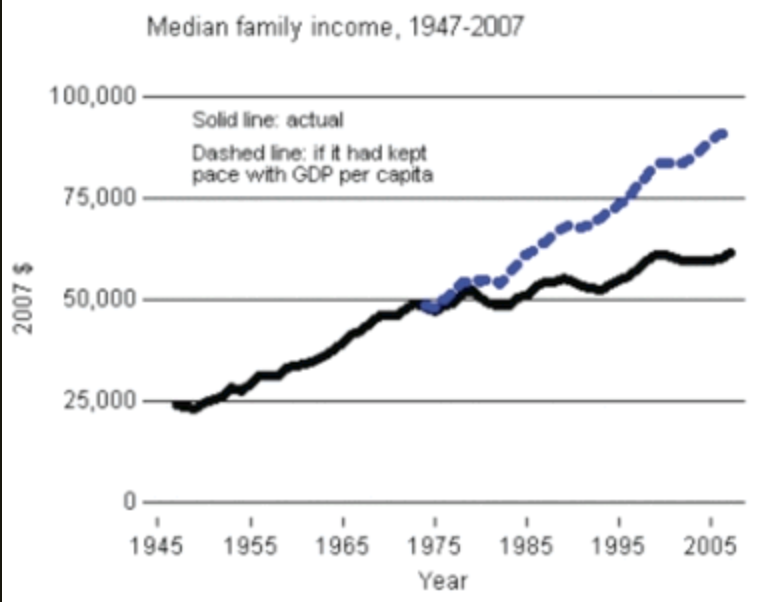
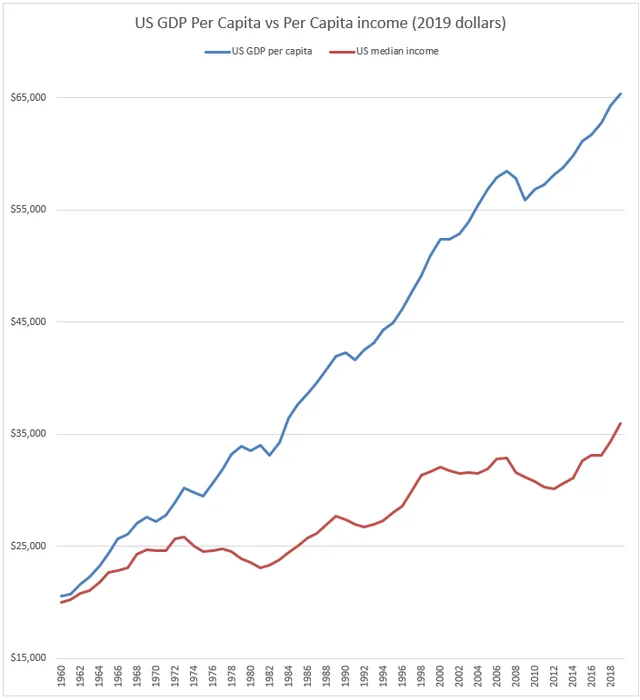
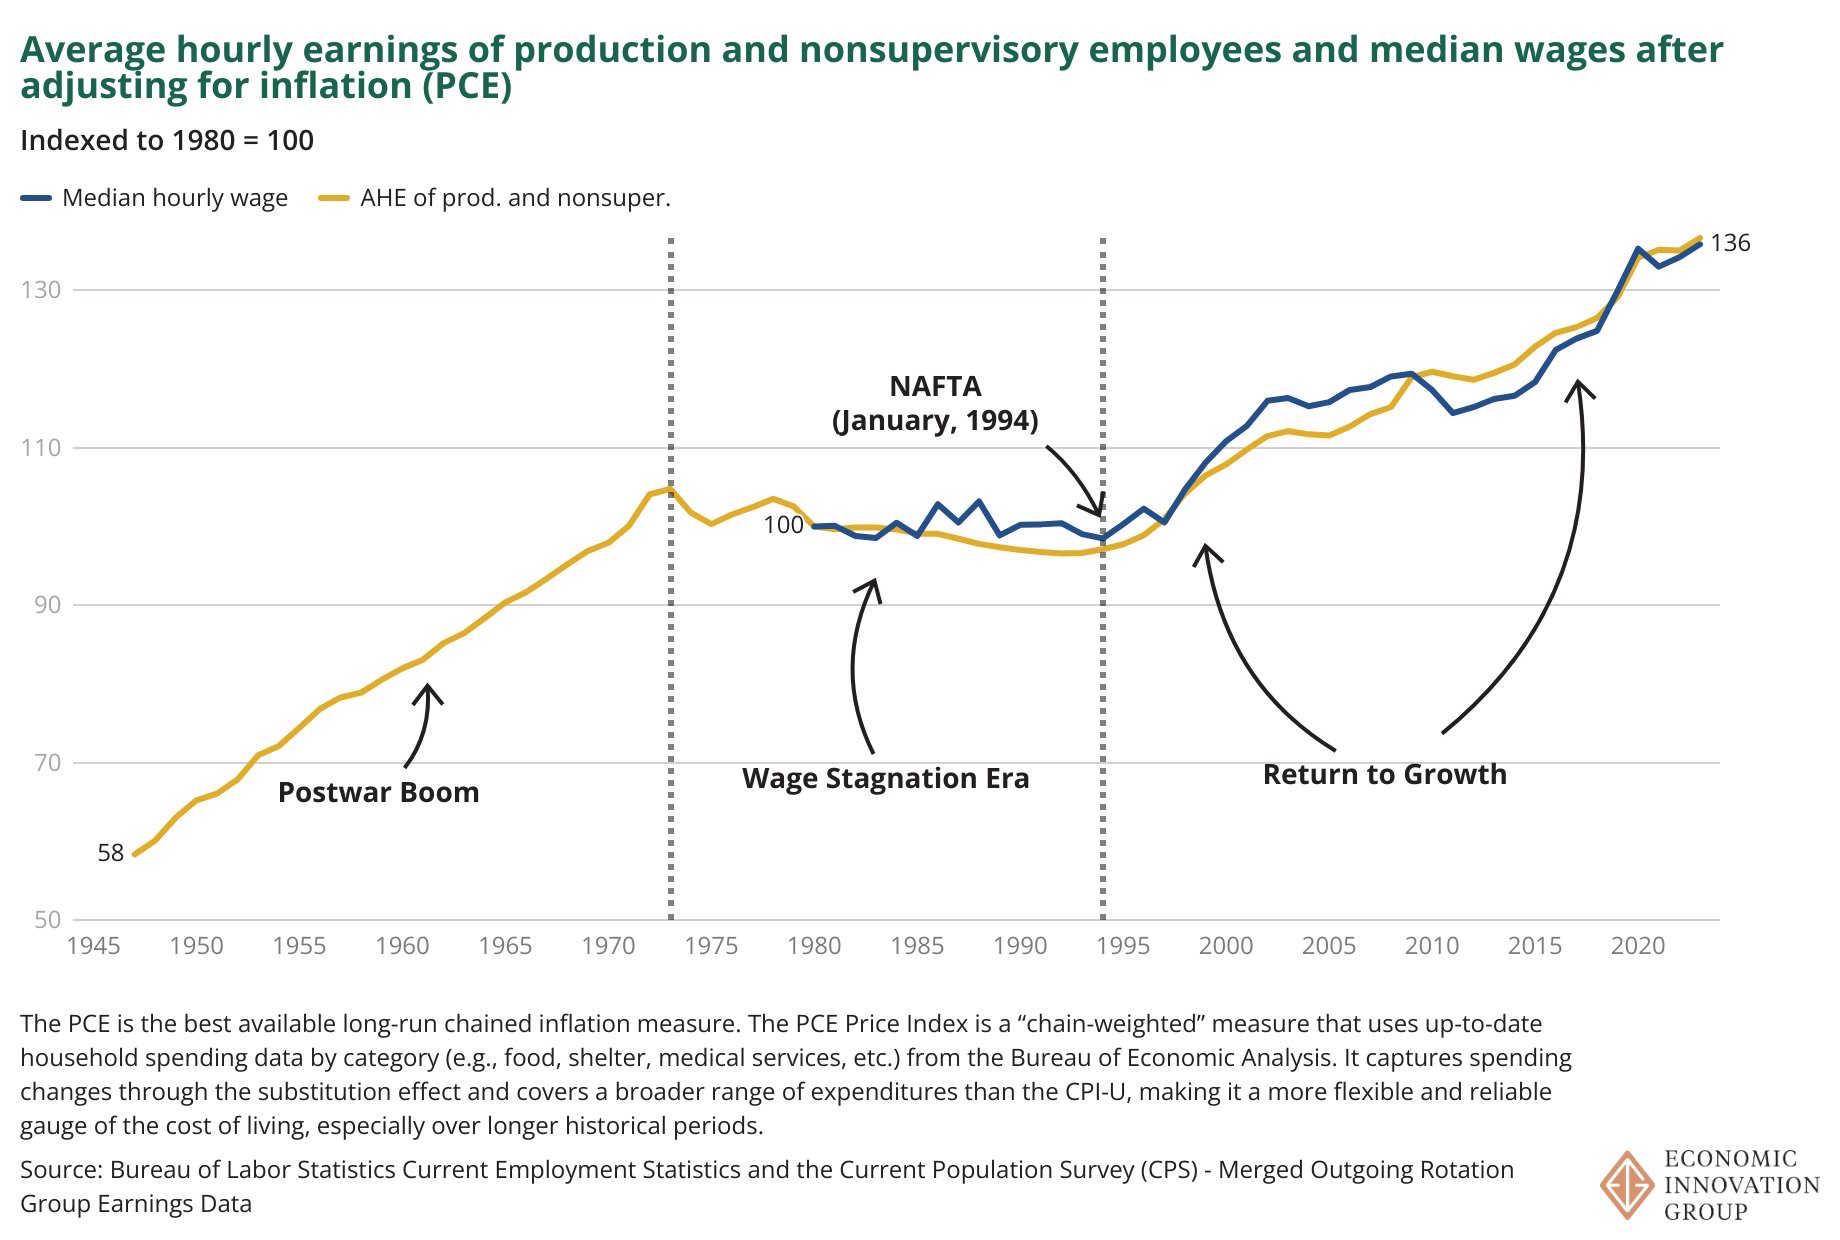
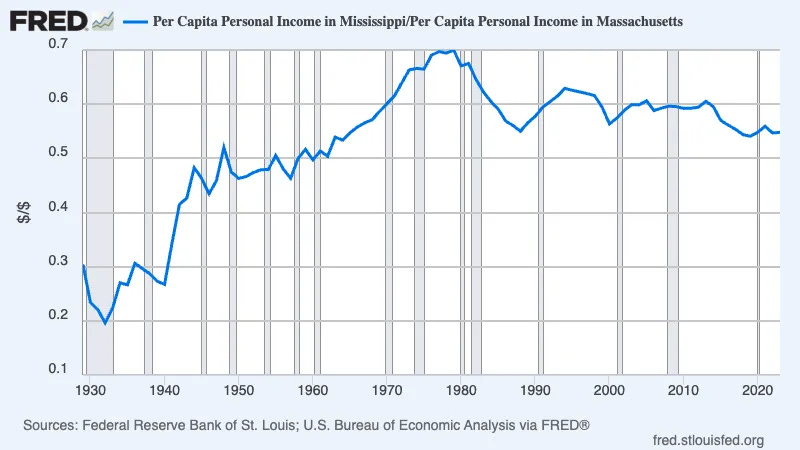
Not only did productivity growth slow down relative to its previous trend, but the median person’s income decoupled from it.
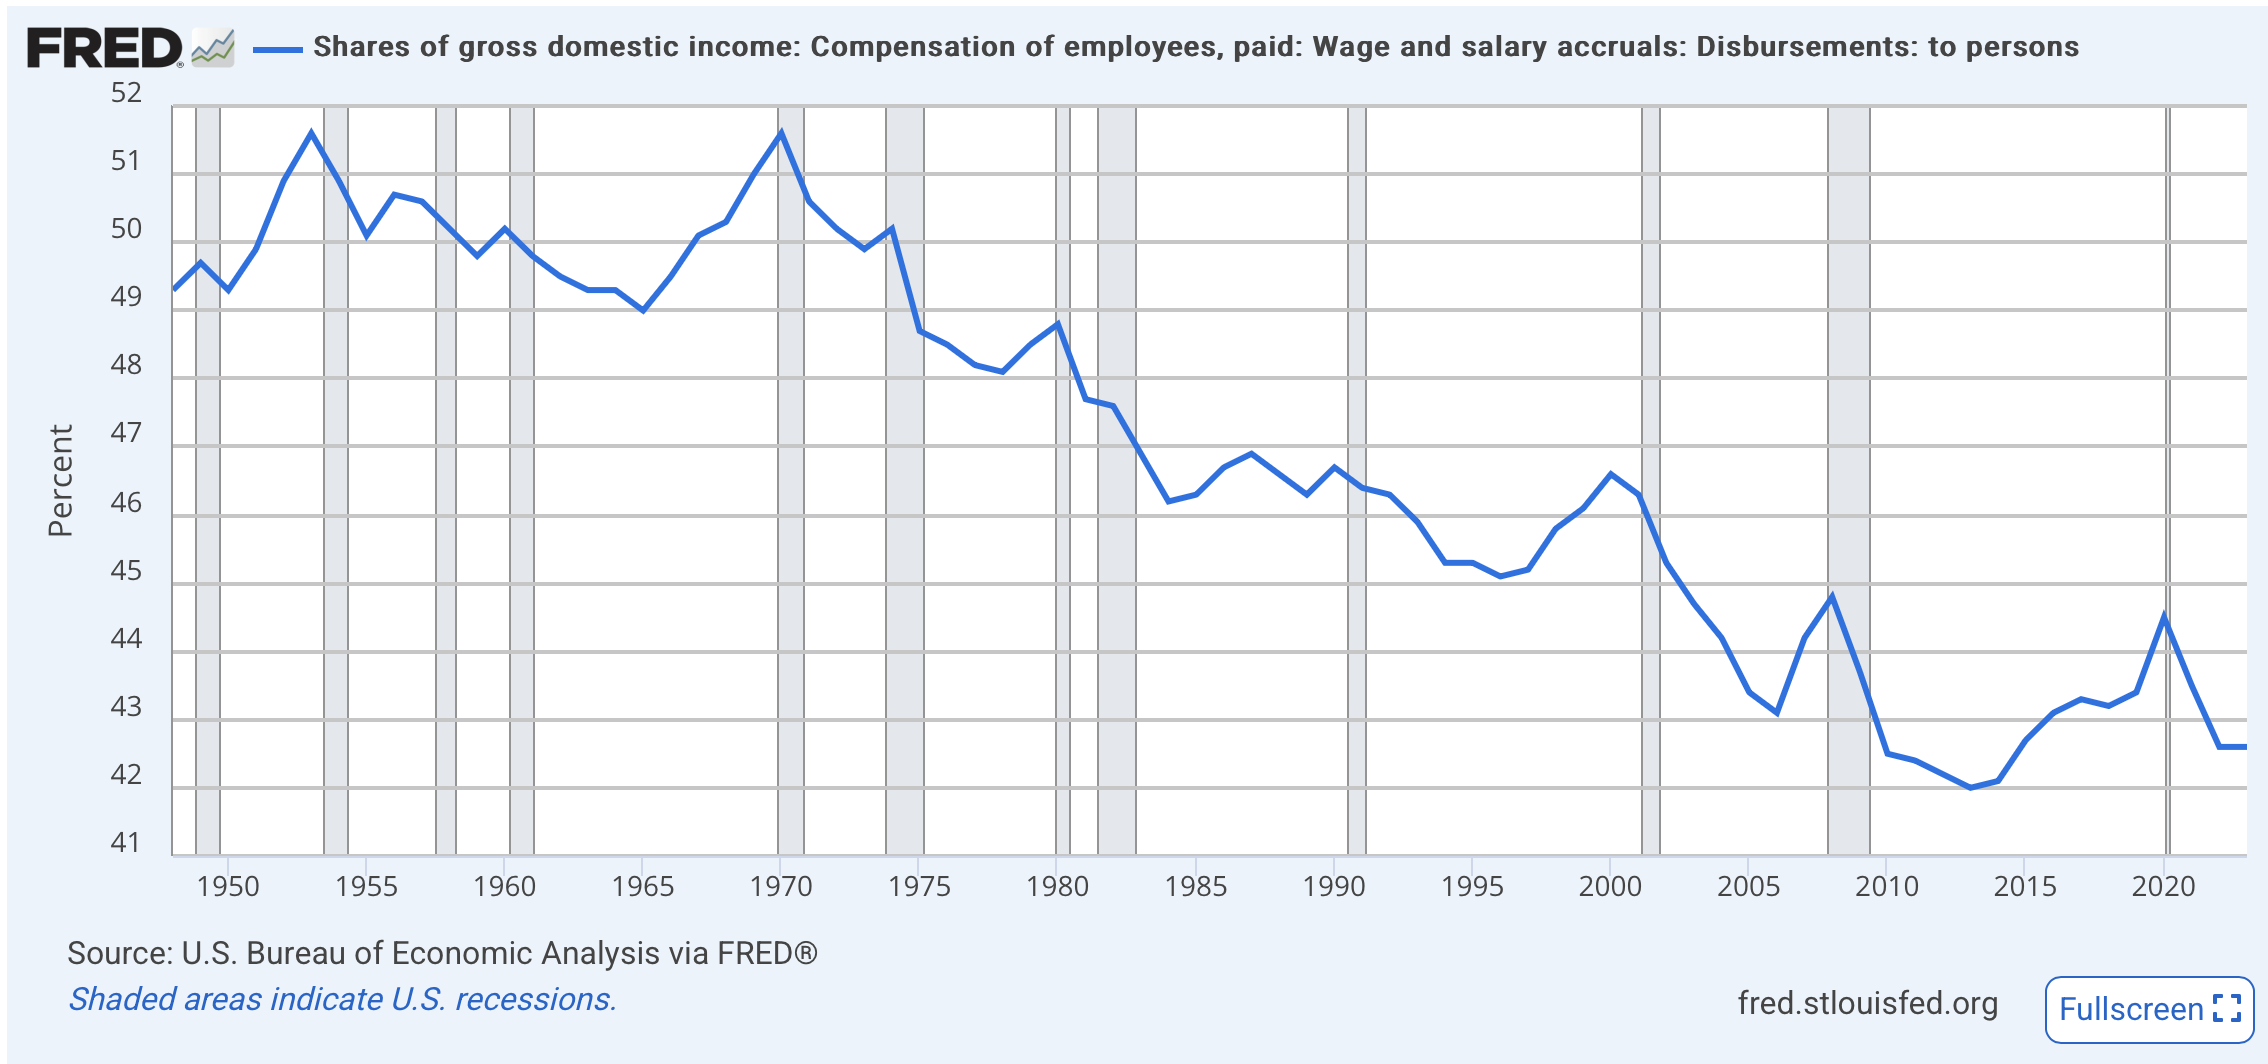
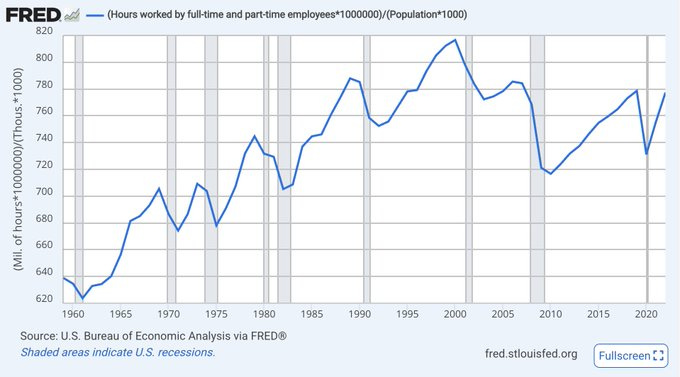
https://fred.stlouisfed.org/series/W270RE1A156NBEA
https://fred.stlouisfed.org/series/A4002E1A156NBEA more broadly labor’s share in the national register peaking in 1970
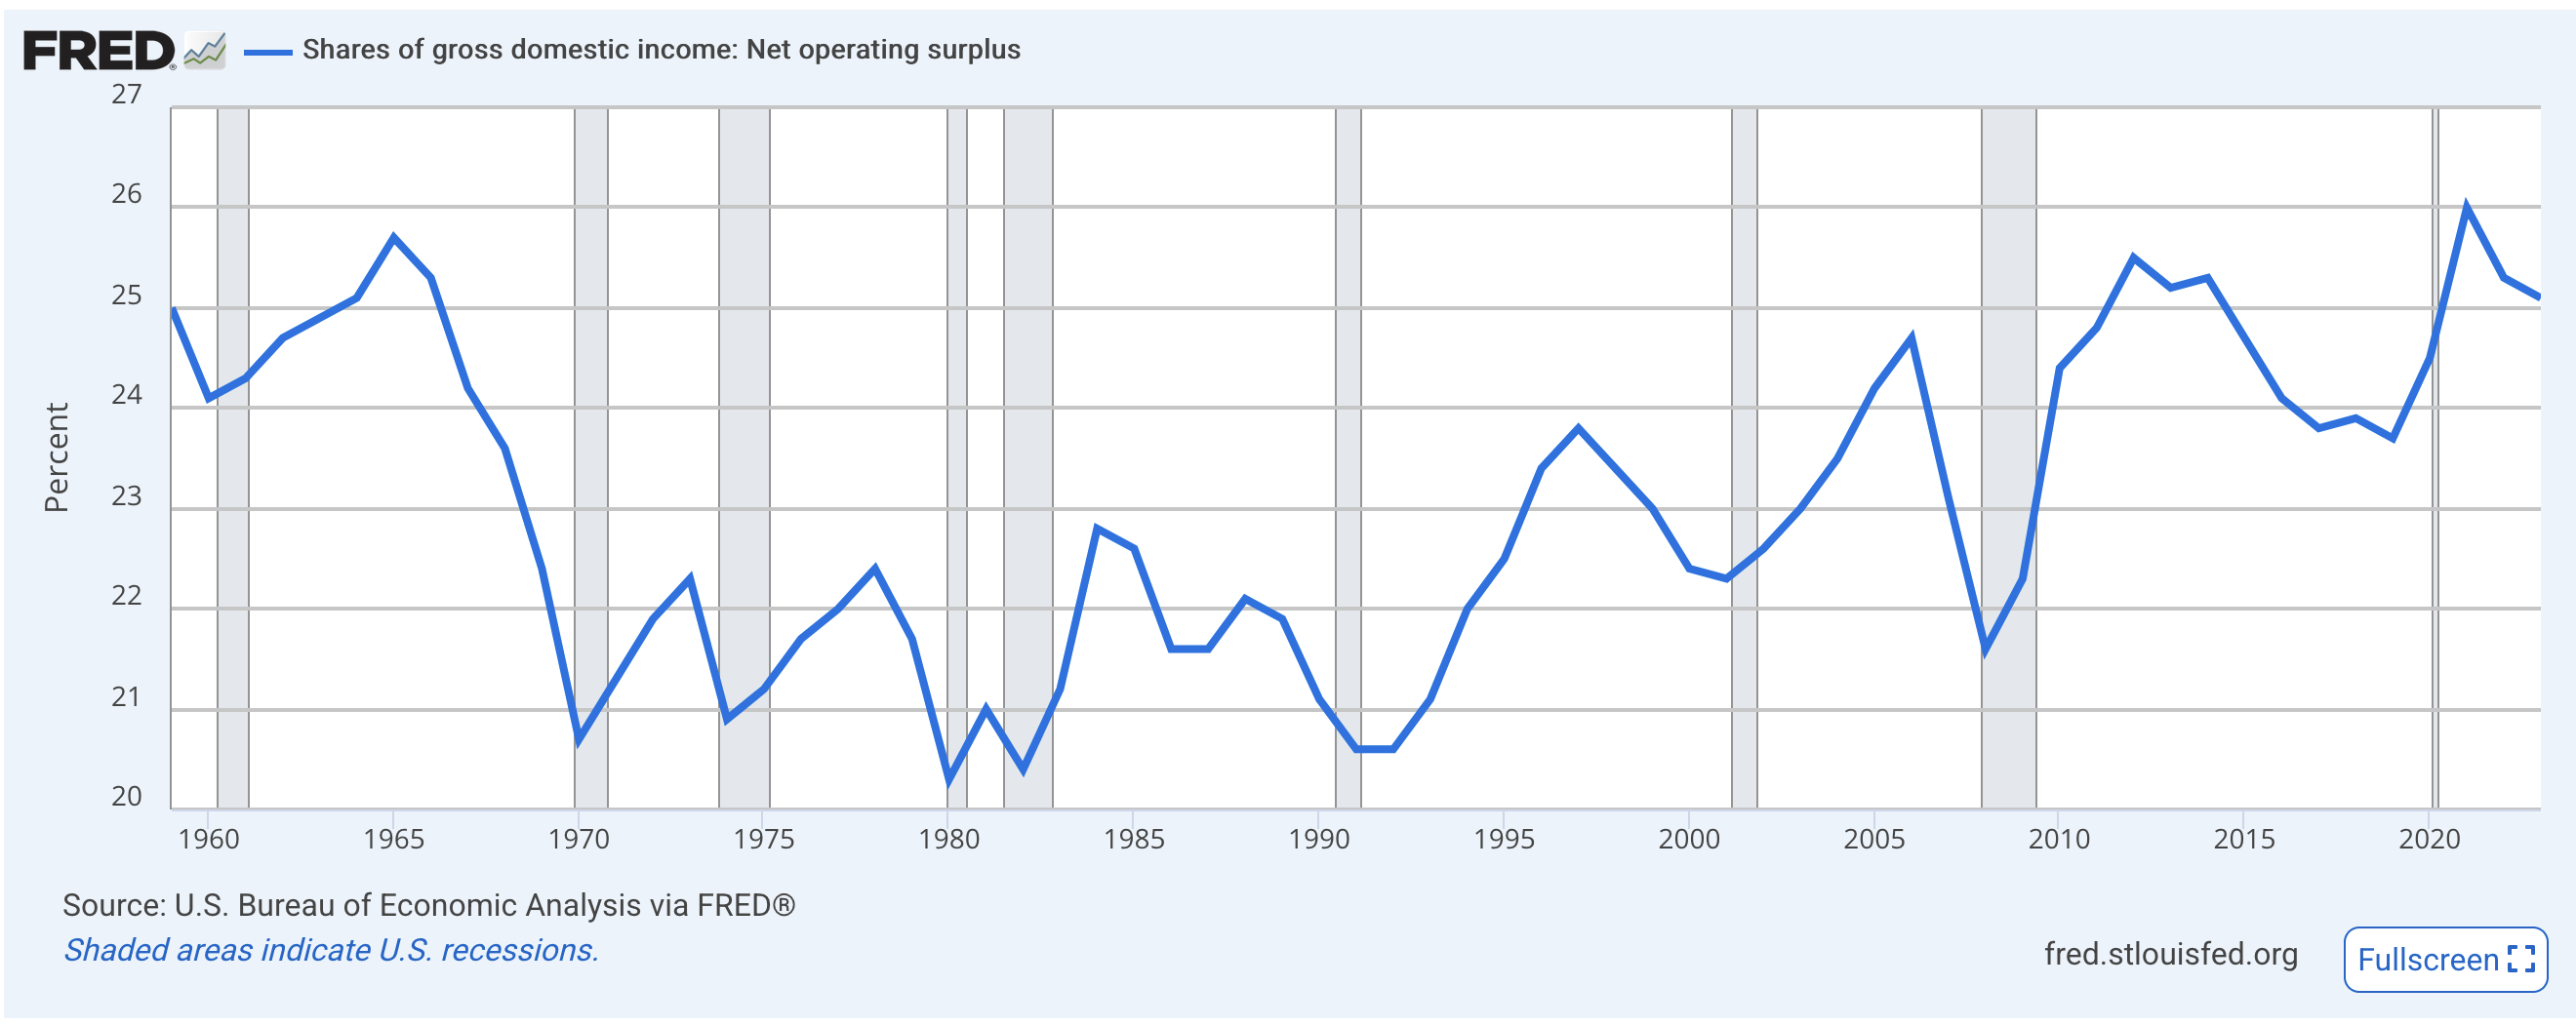
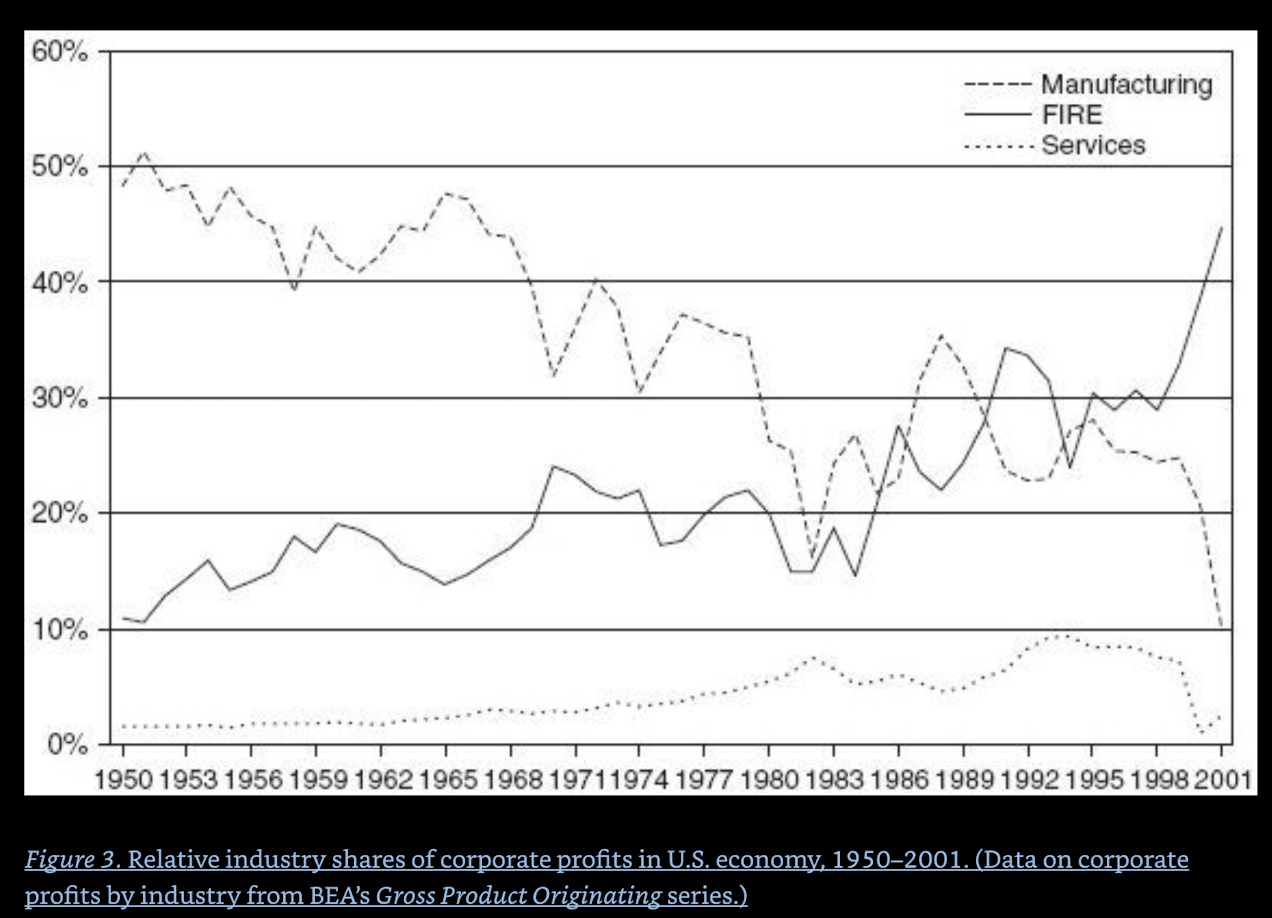
Conversely corporate profits bottomed out.
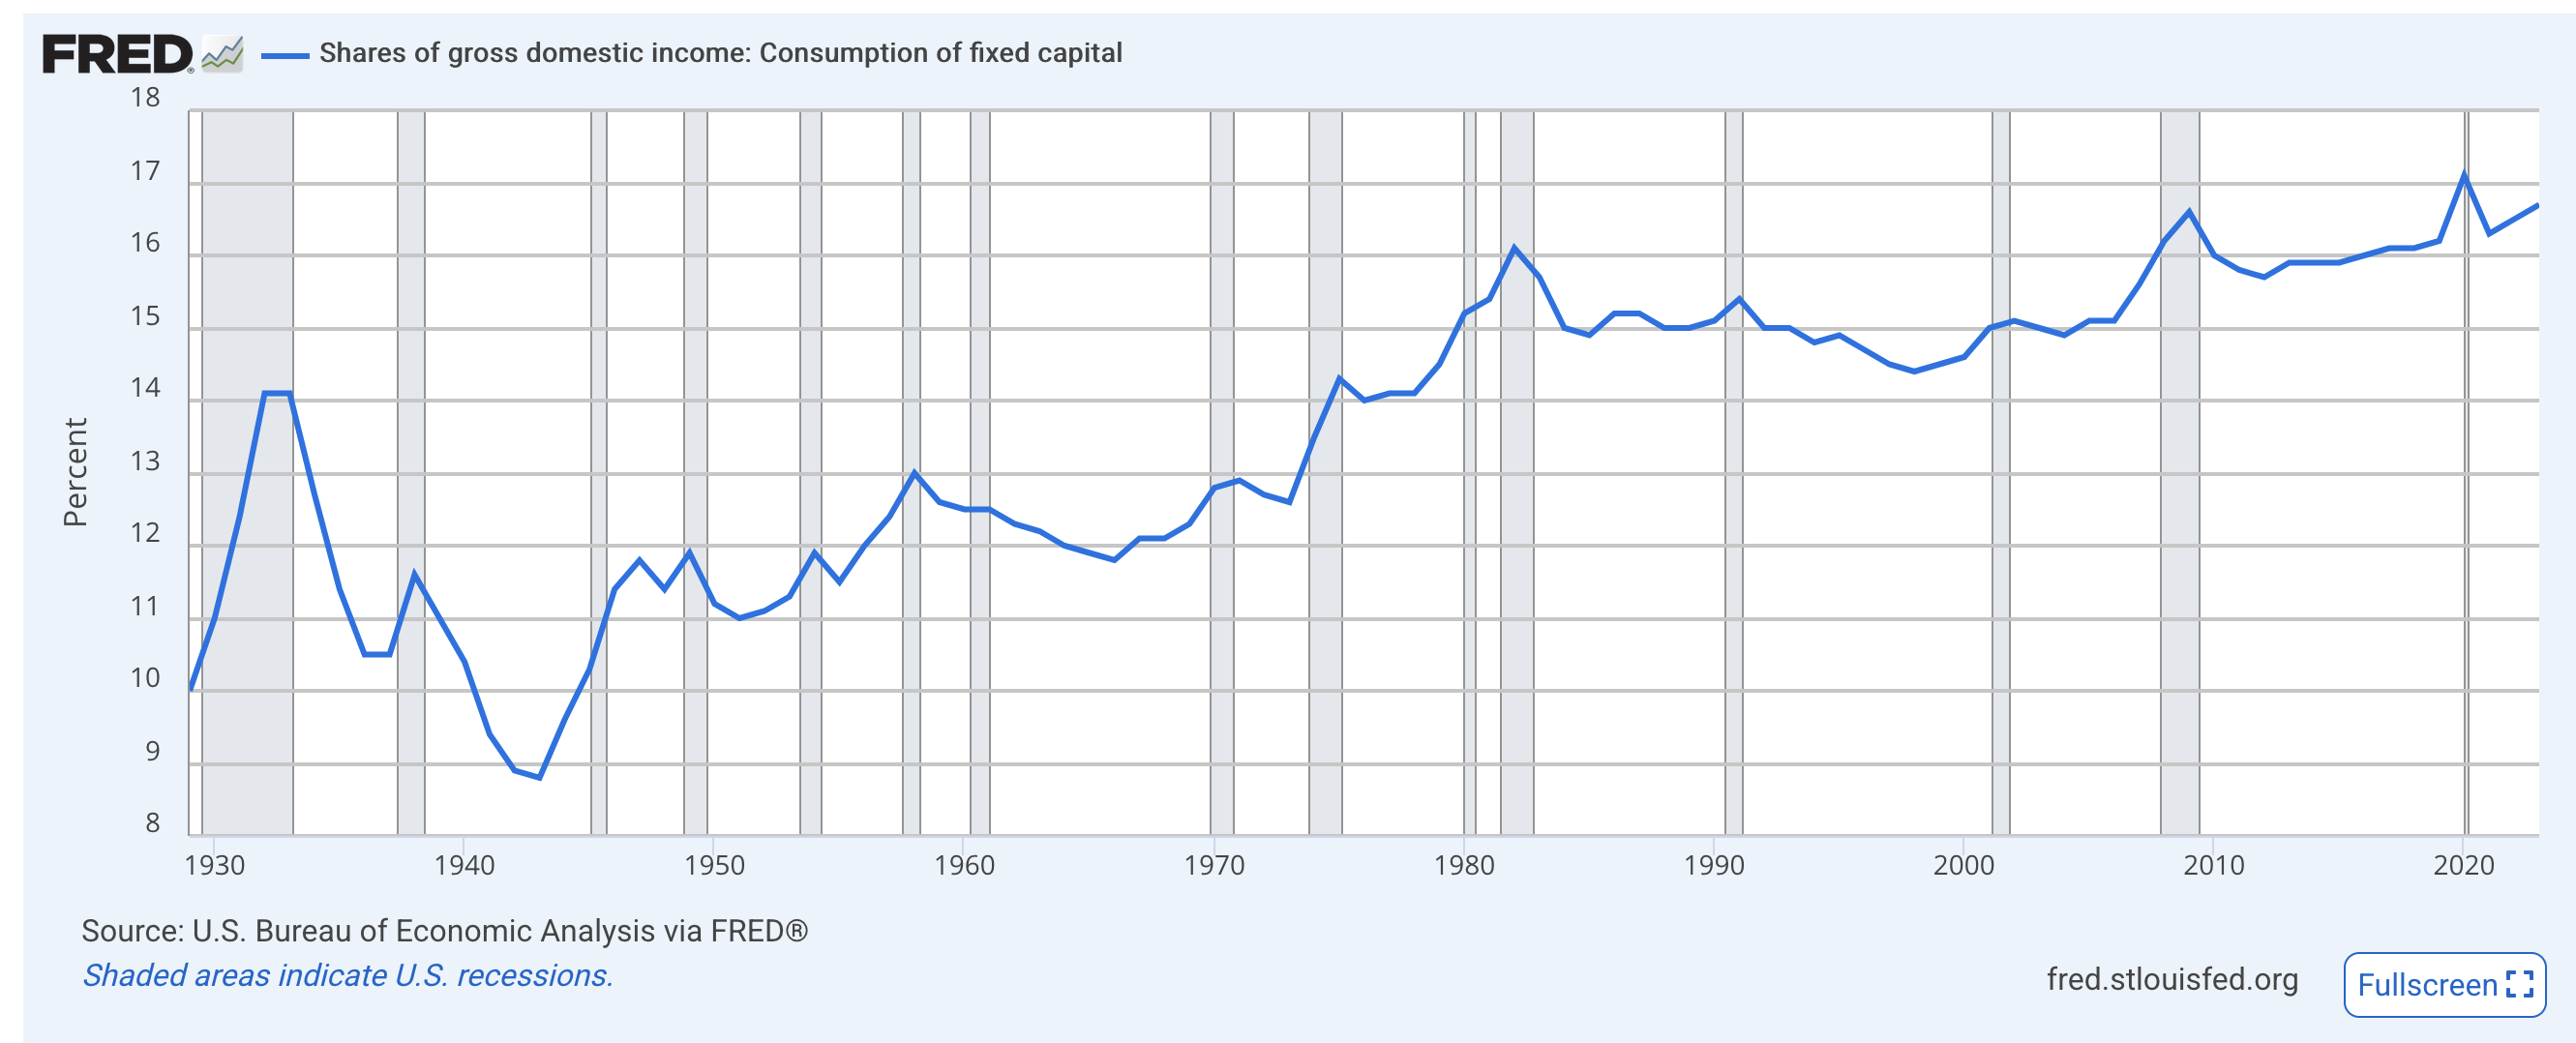
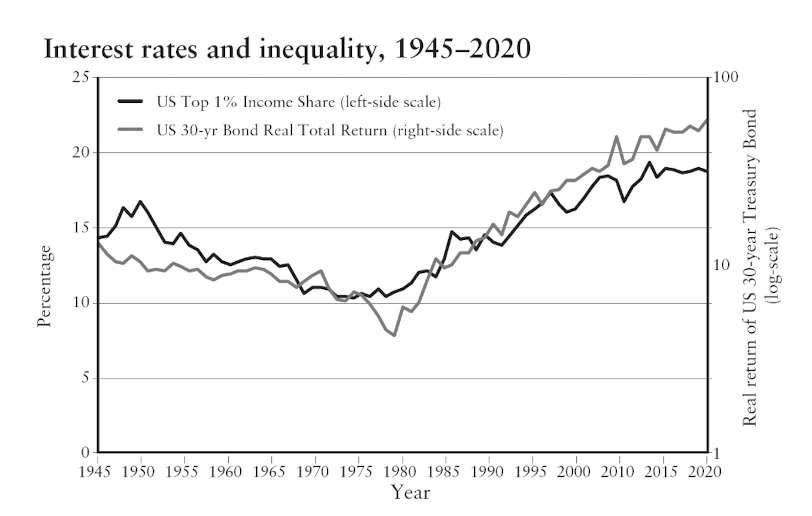
And capital marched upward
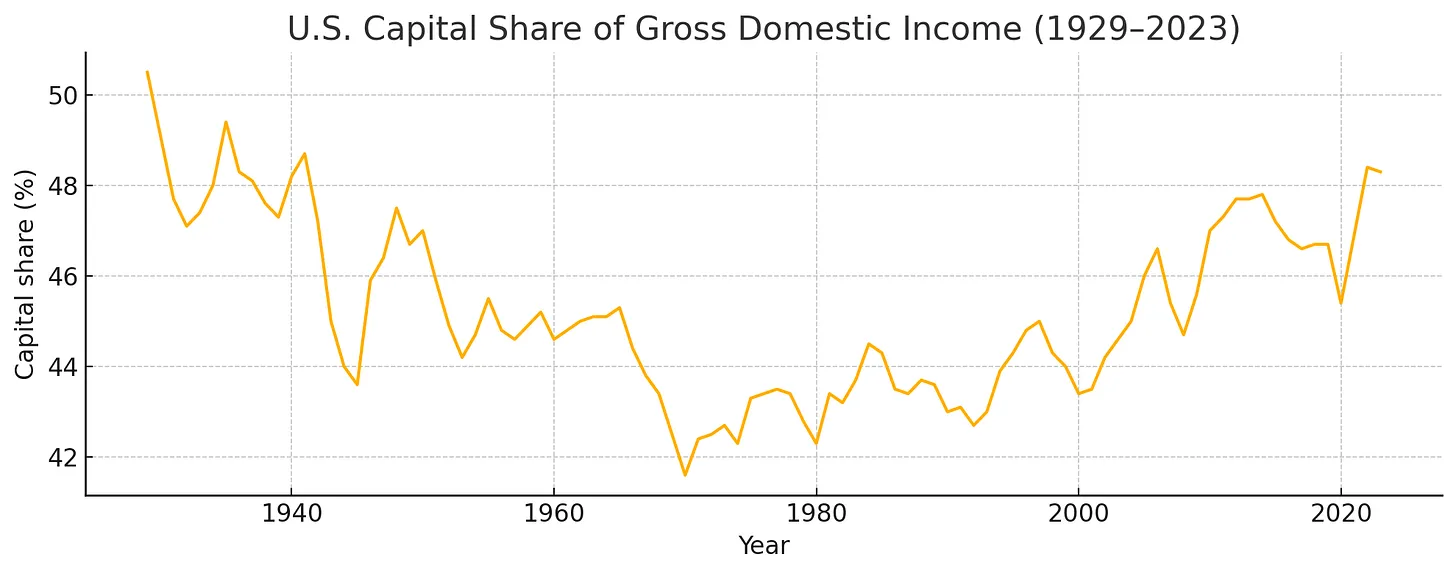
doesn’t decouple till 80 or so
The uninterupted rise in GDP and lack of rise in the average person’s wellbeing/compensation is puzzling to me. Is that GDP real? Are we overstating gdp somehow?
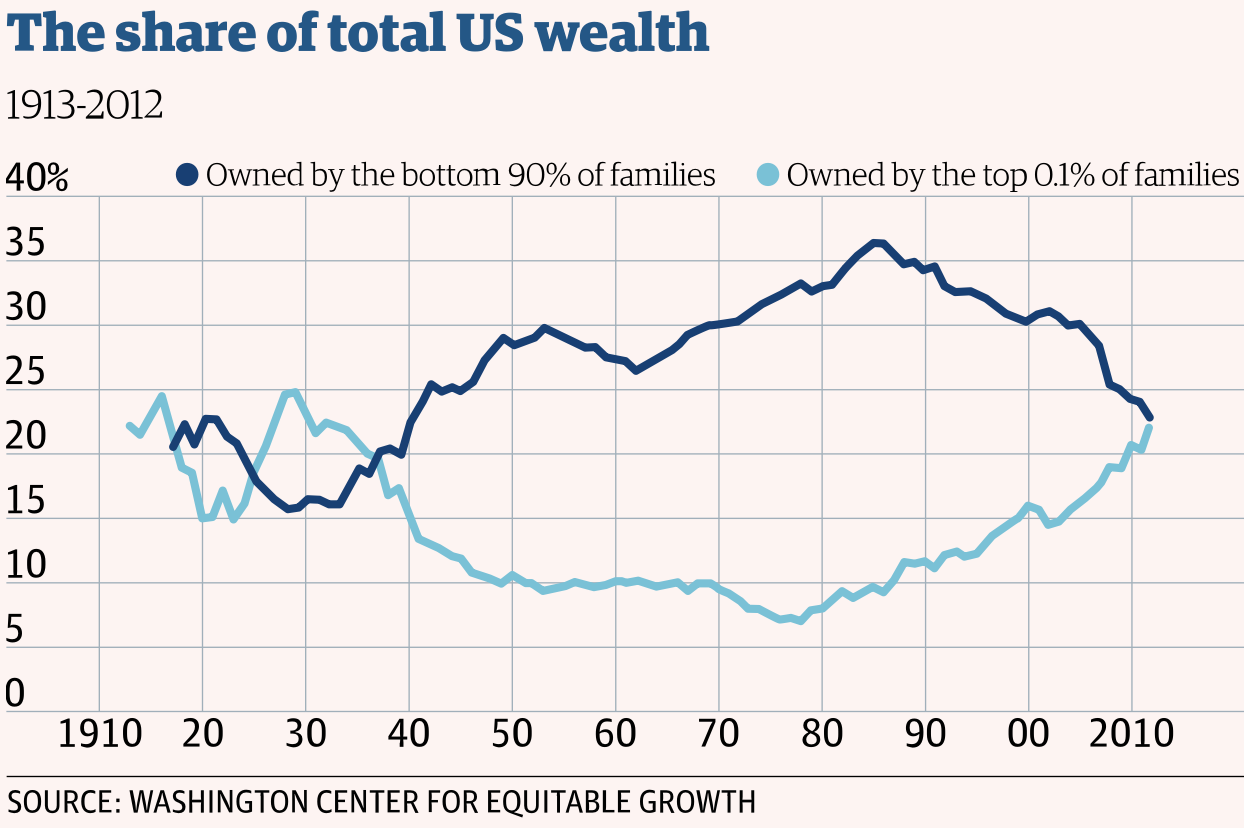
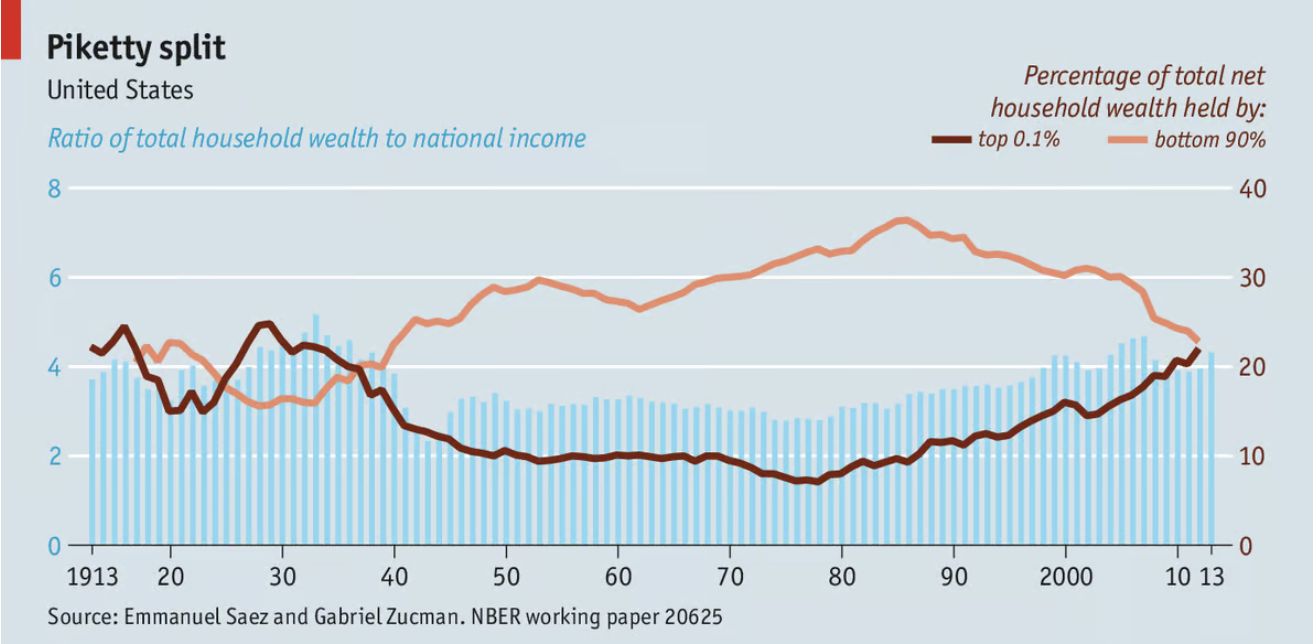
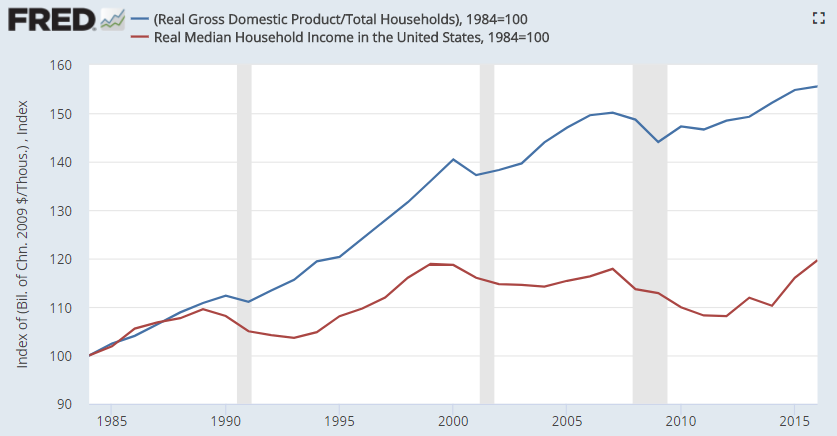
A relentless decline since ’85
https://www.economist.com/finance-and-economics/2014/11/06/forget-the-1
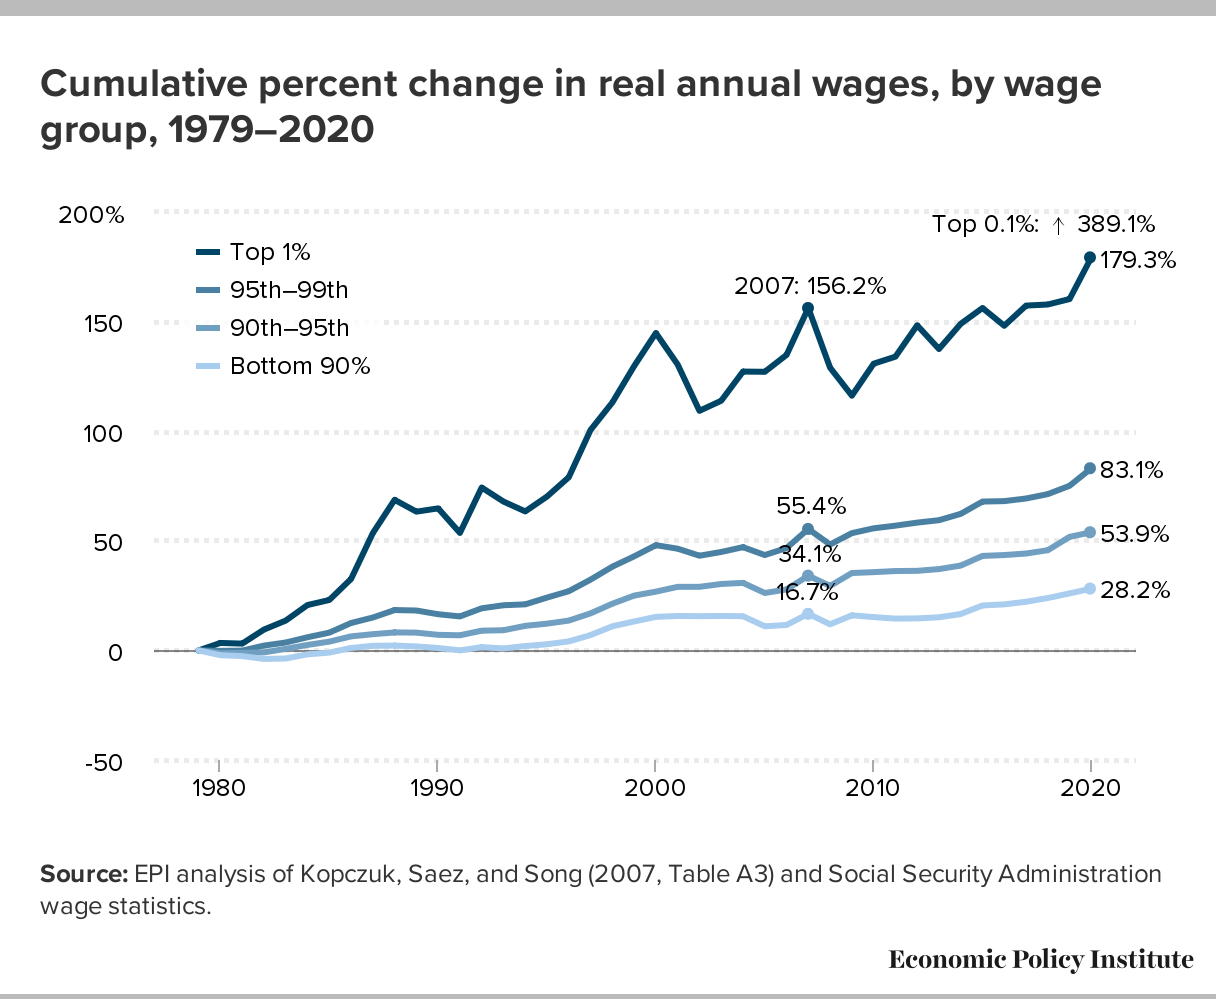
To be fair, the bottom 90 couldn’t exactly 4x their income without the whole economy growing to a ridiculous degree.
The above graphs tell the main narrative. Something happened in the early 70s. SUDDENLY: Productivity growth slowed, gdp growth slowed, energy use stagnated, median income/wealth growth stagnated. By the mid 80s, the economy was increasingly geared towards benefitting the wealthiest.
There was not a major war or a major depression, at least not significantly bigger than those seen 35 years previously. For apparantly no reason, the period with the greatest widespread prosperity gains is all of history came to a screeching halt.
Now I’ll dive into some other wtf1973 stuff. I’ll weave all of these into a cogent narrative in detail afterwards.
Energy
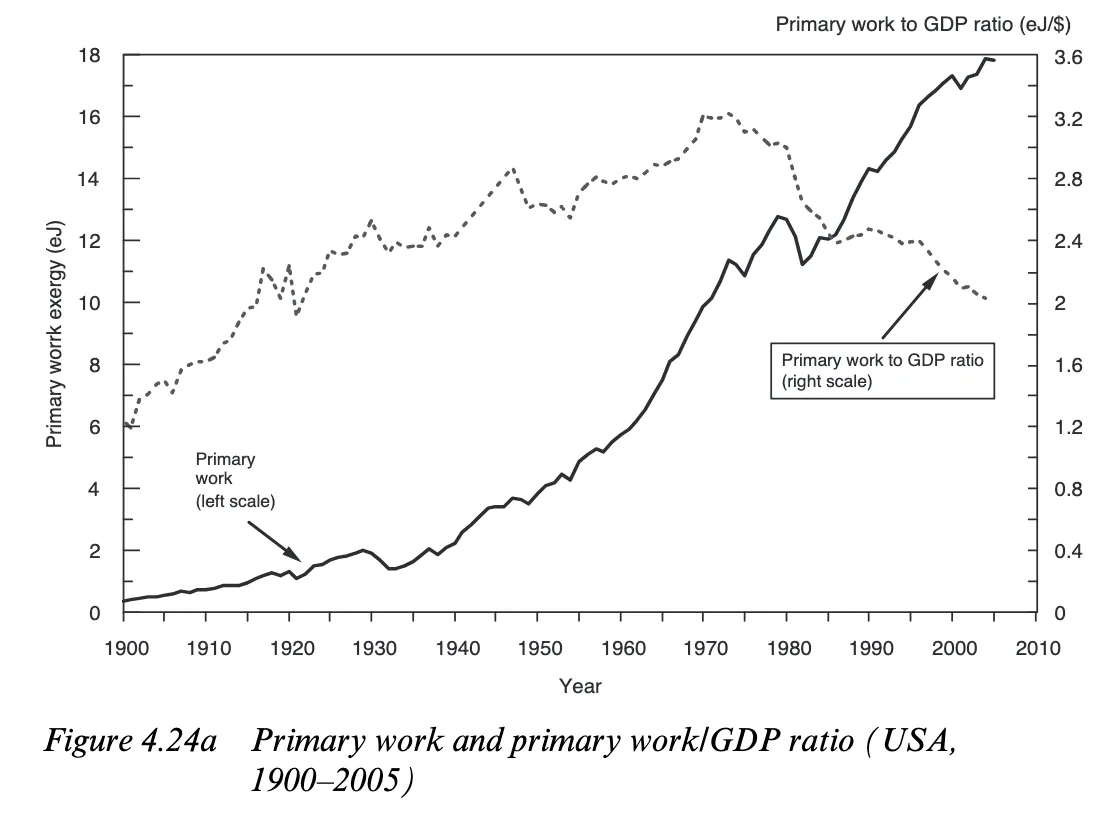
Note the peak in energy intensity to gdp in 1973
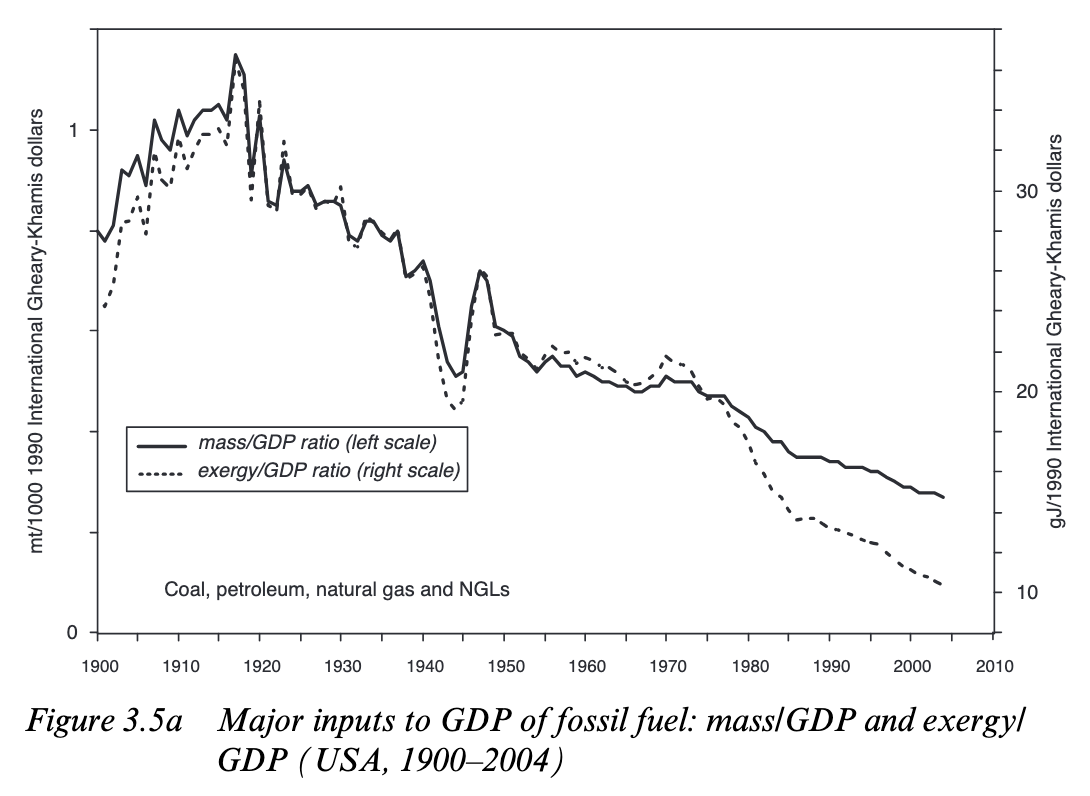
It’s commonly said (by smil) that this is something that happens for all industrial economies, but really energy use is obscured by conversion efficiency. In reality, useful energy per gdp peaks in 1973.
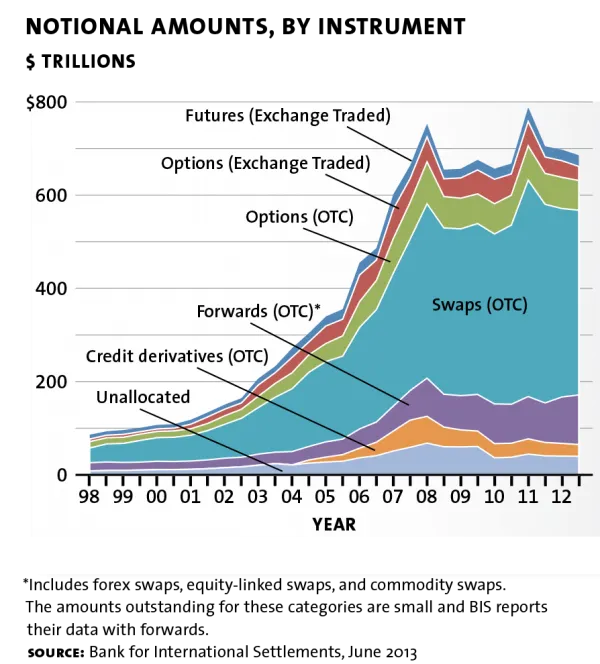
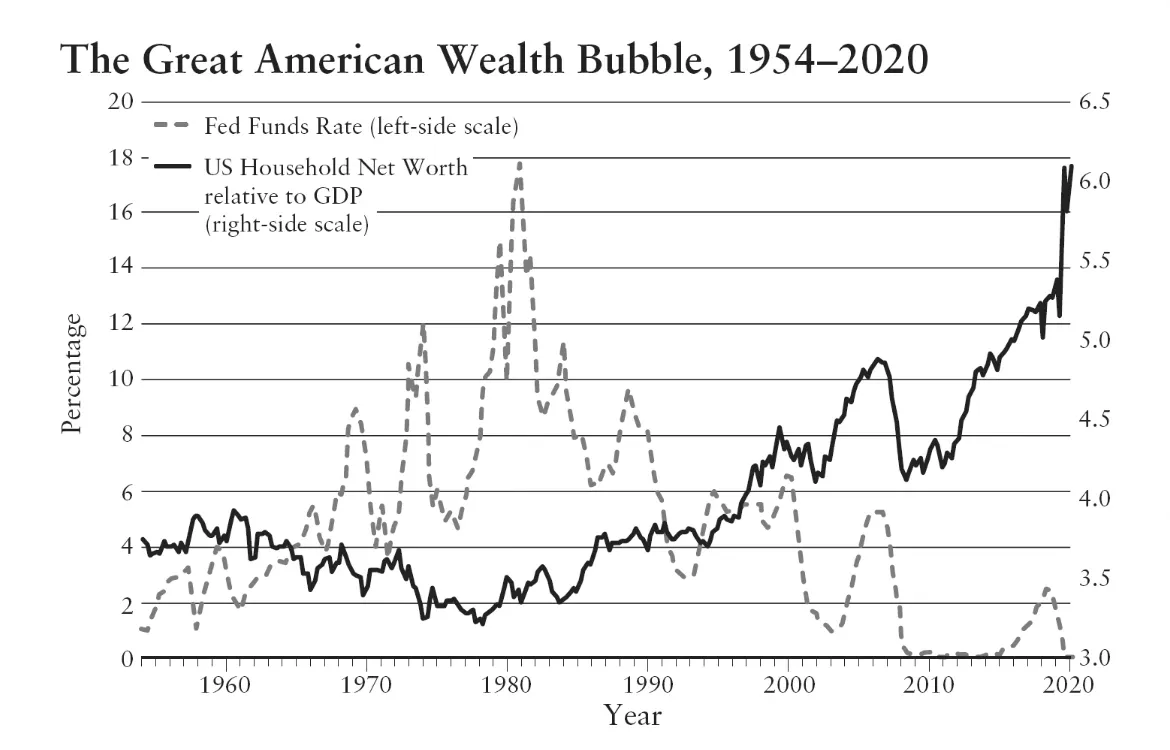
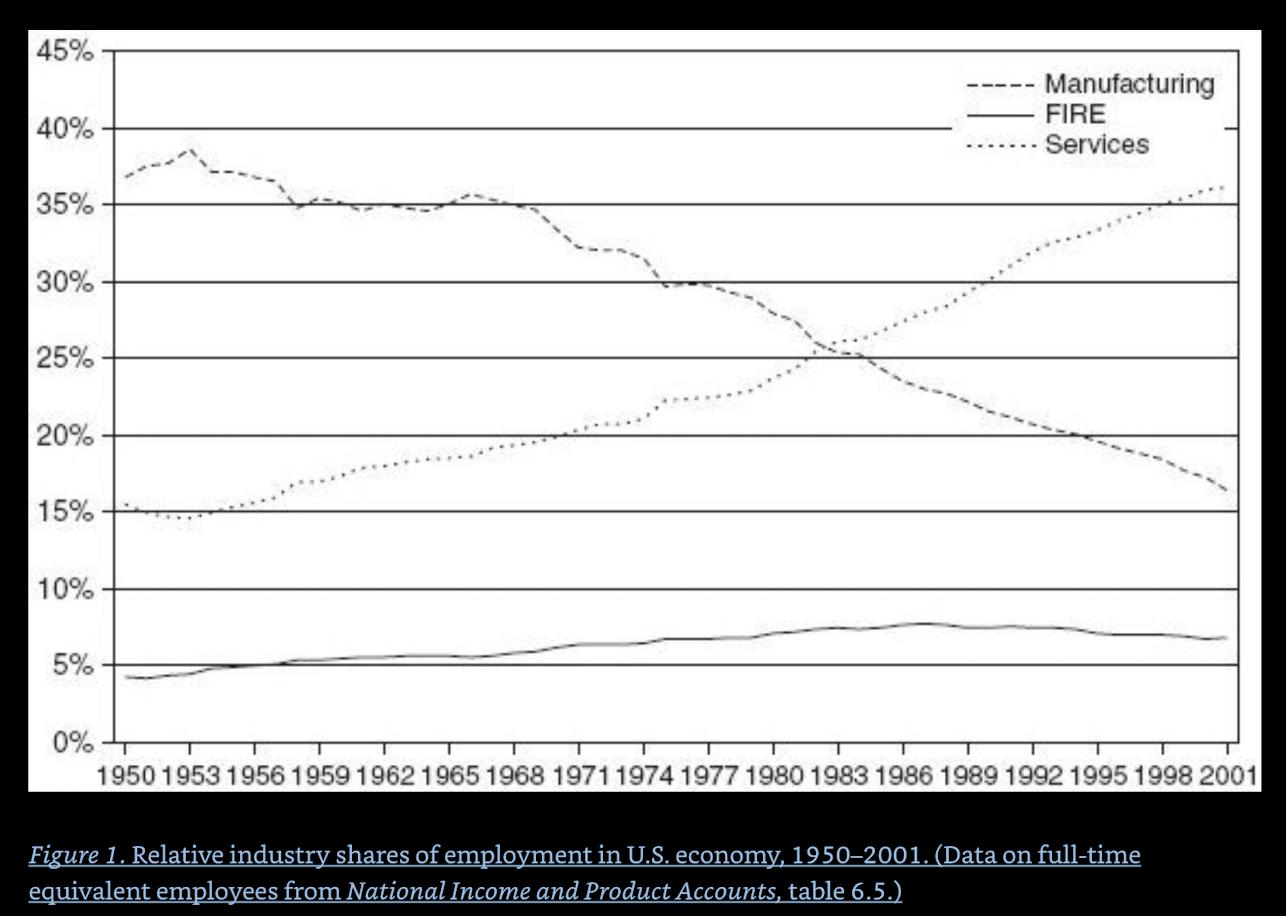
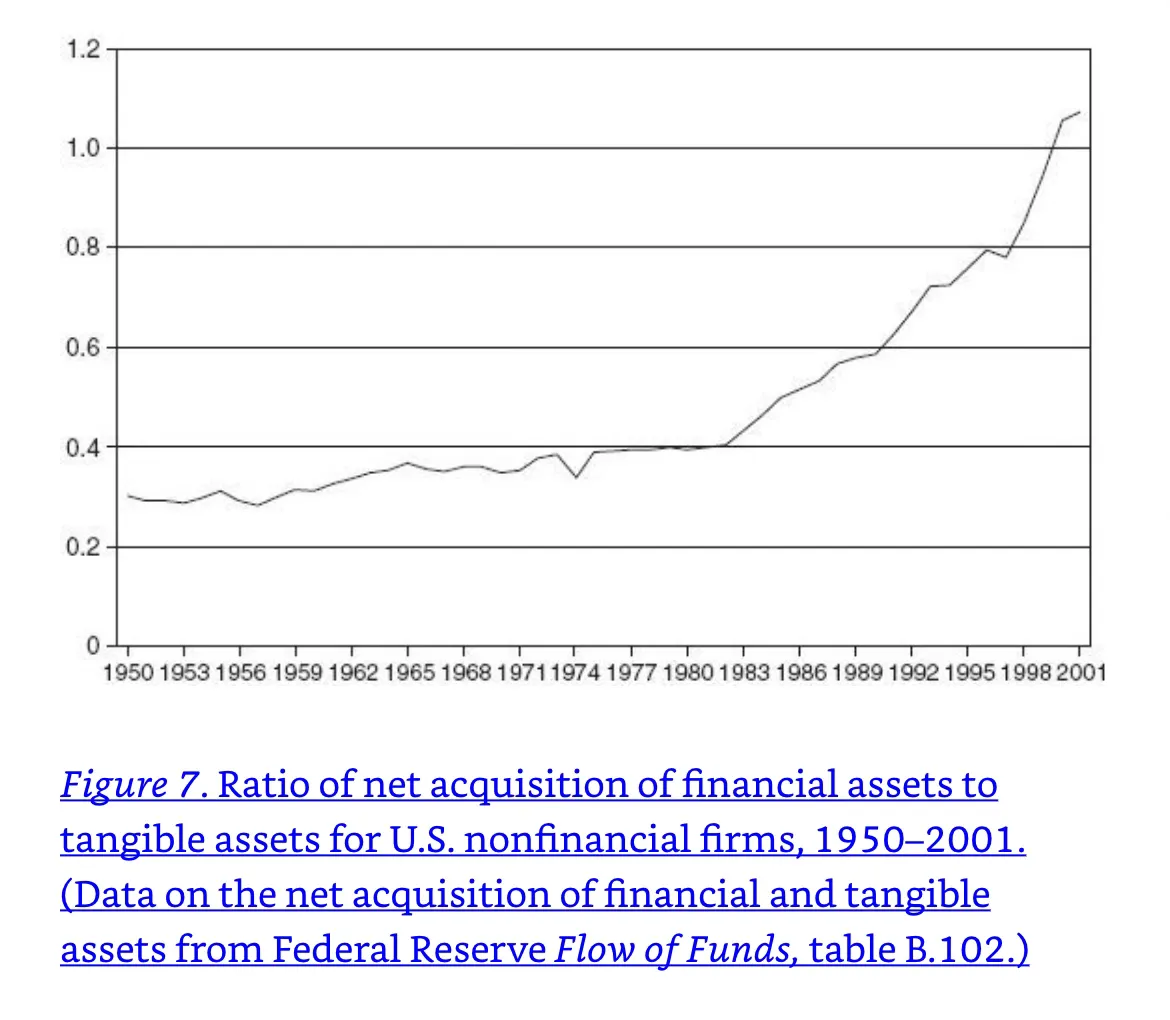
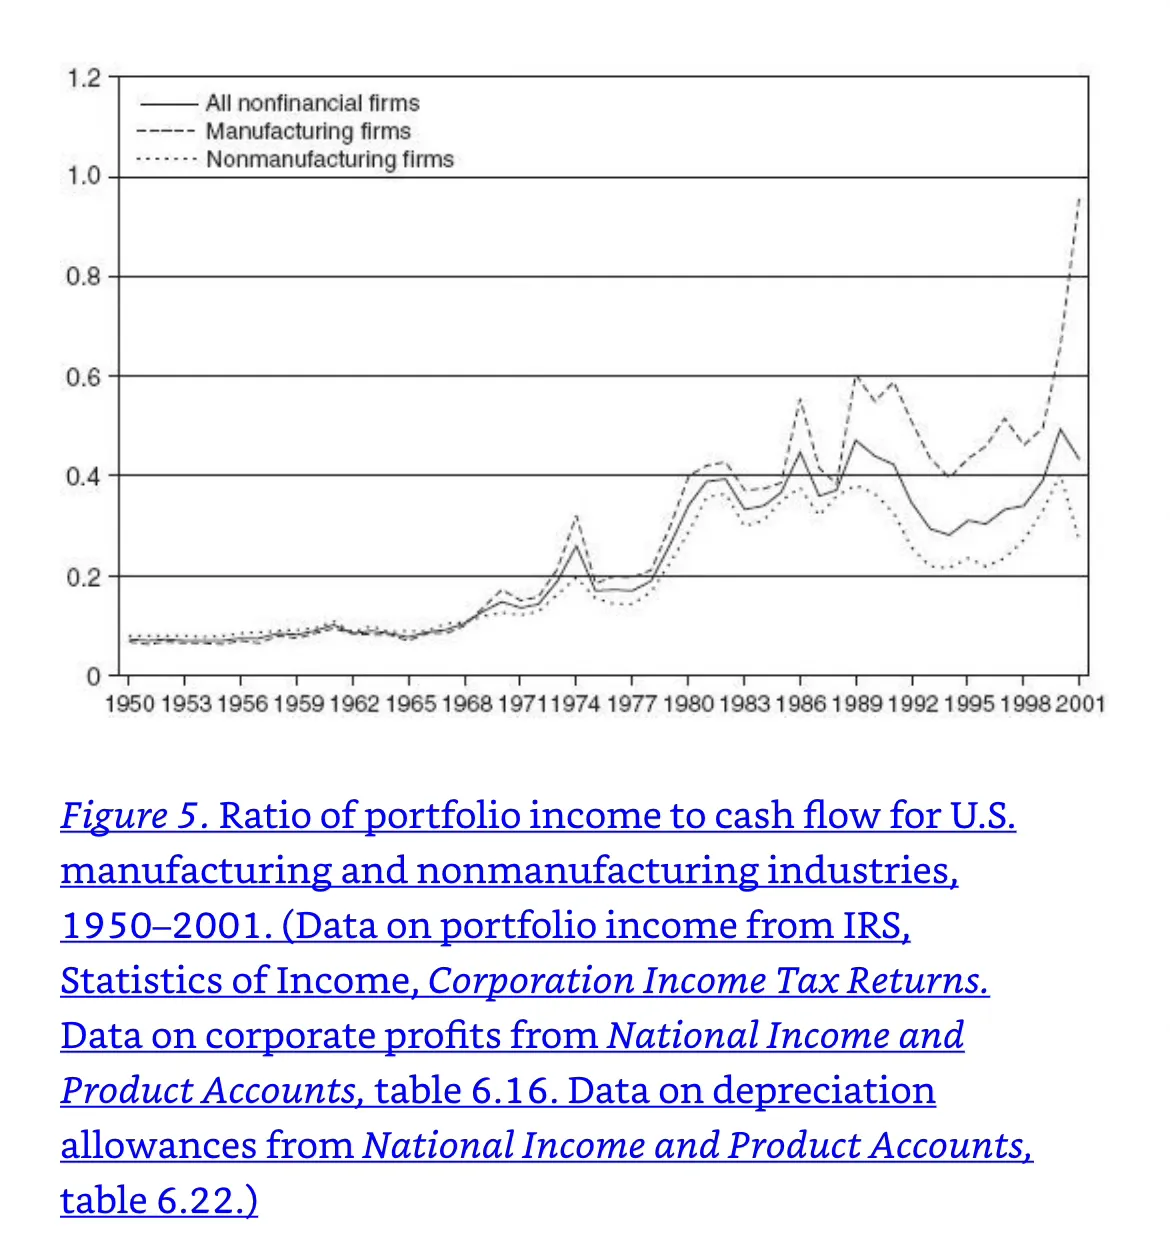
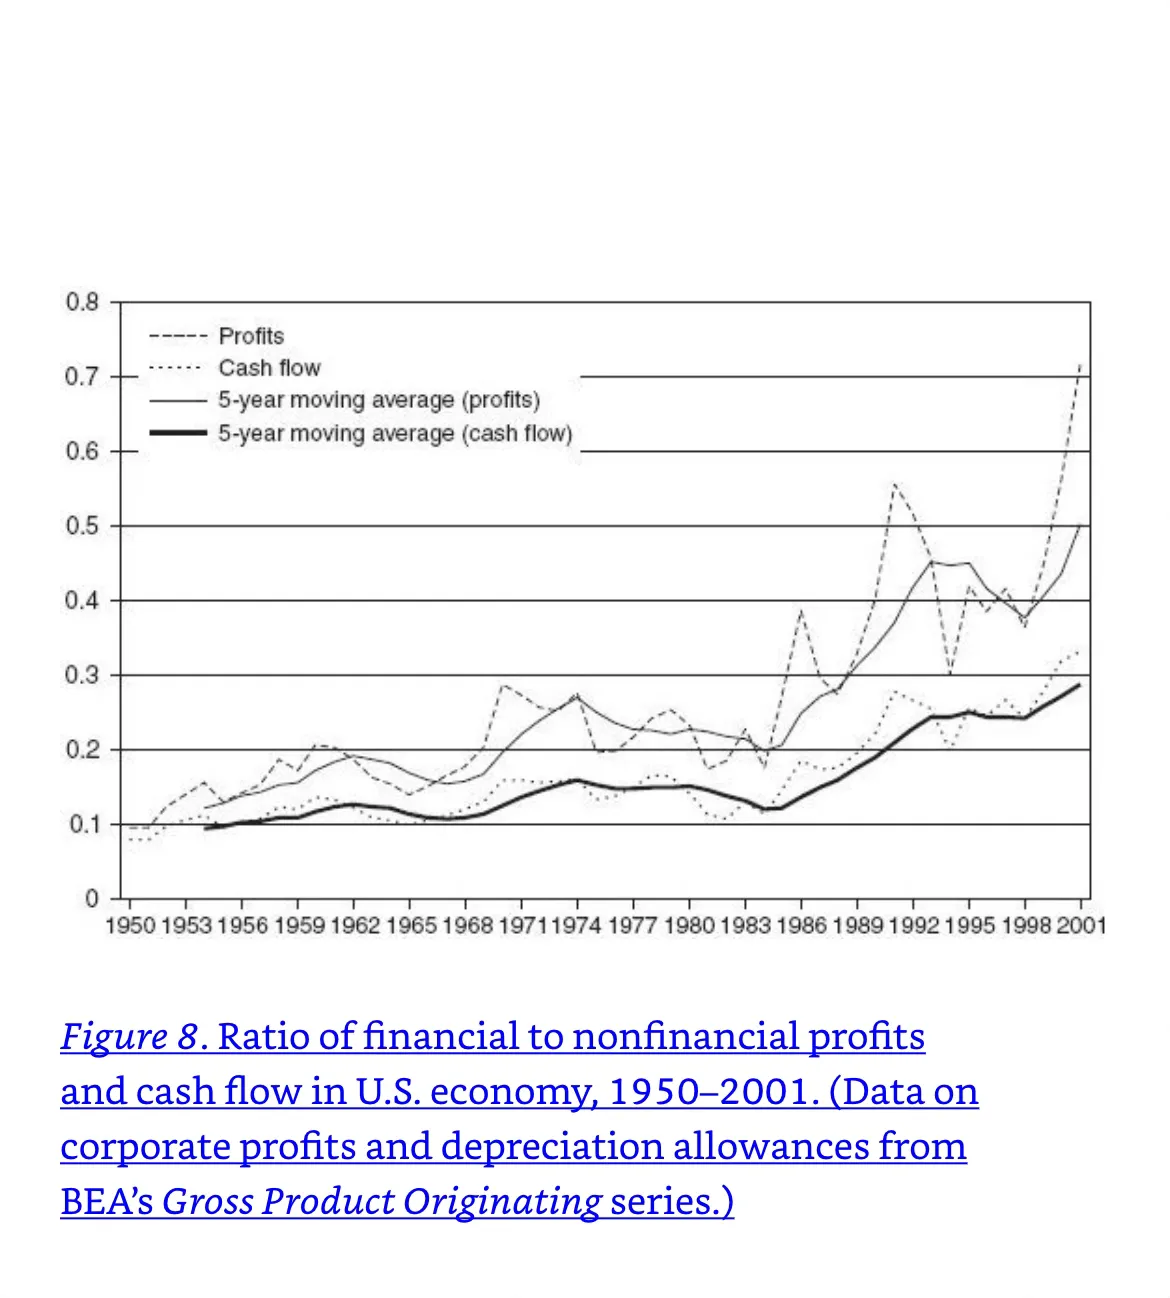
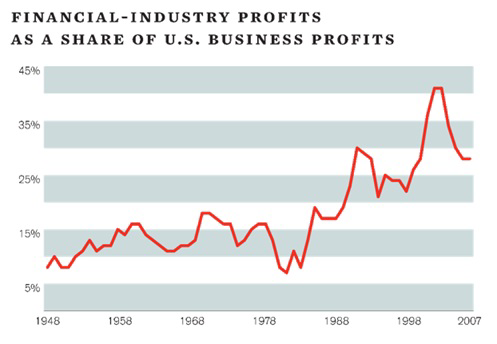
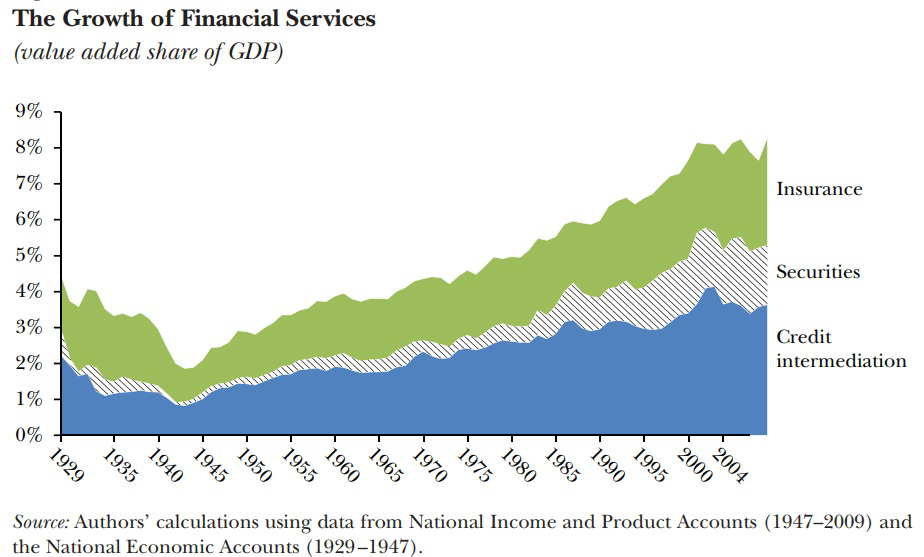
Finacials

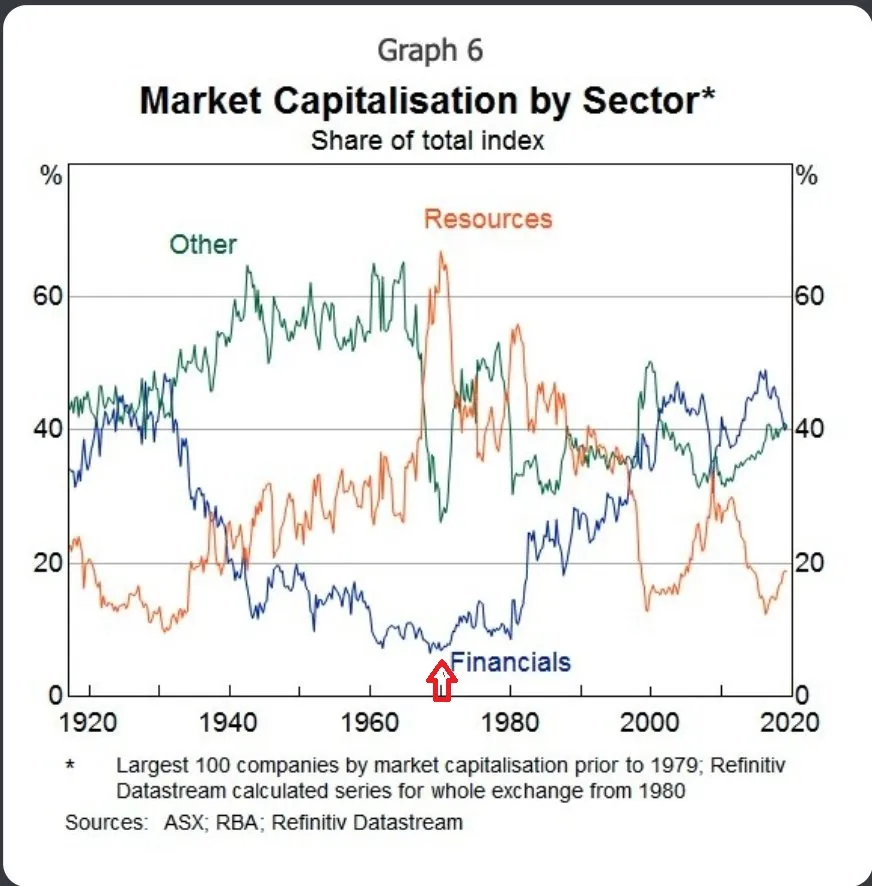
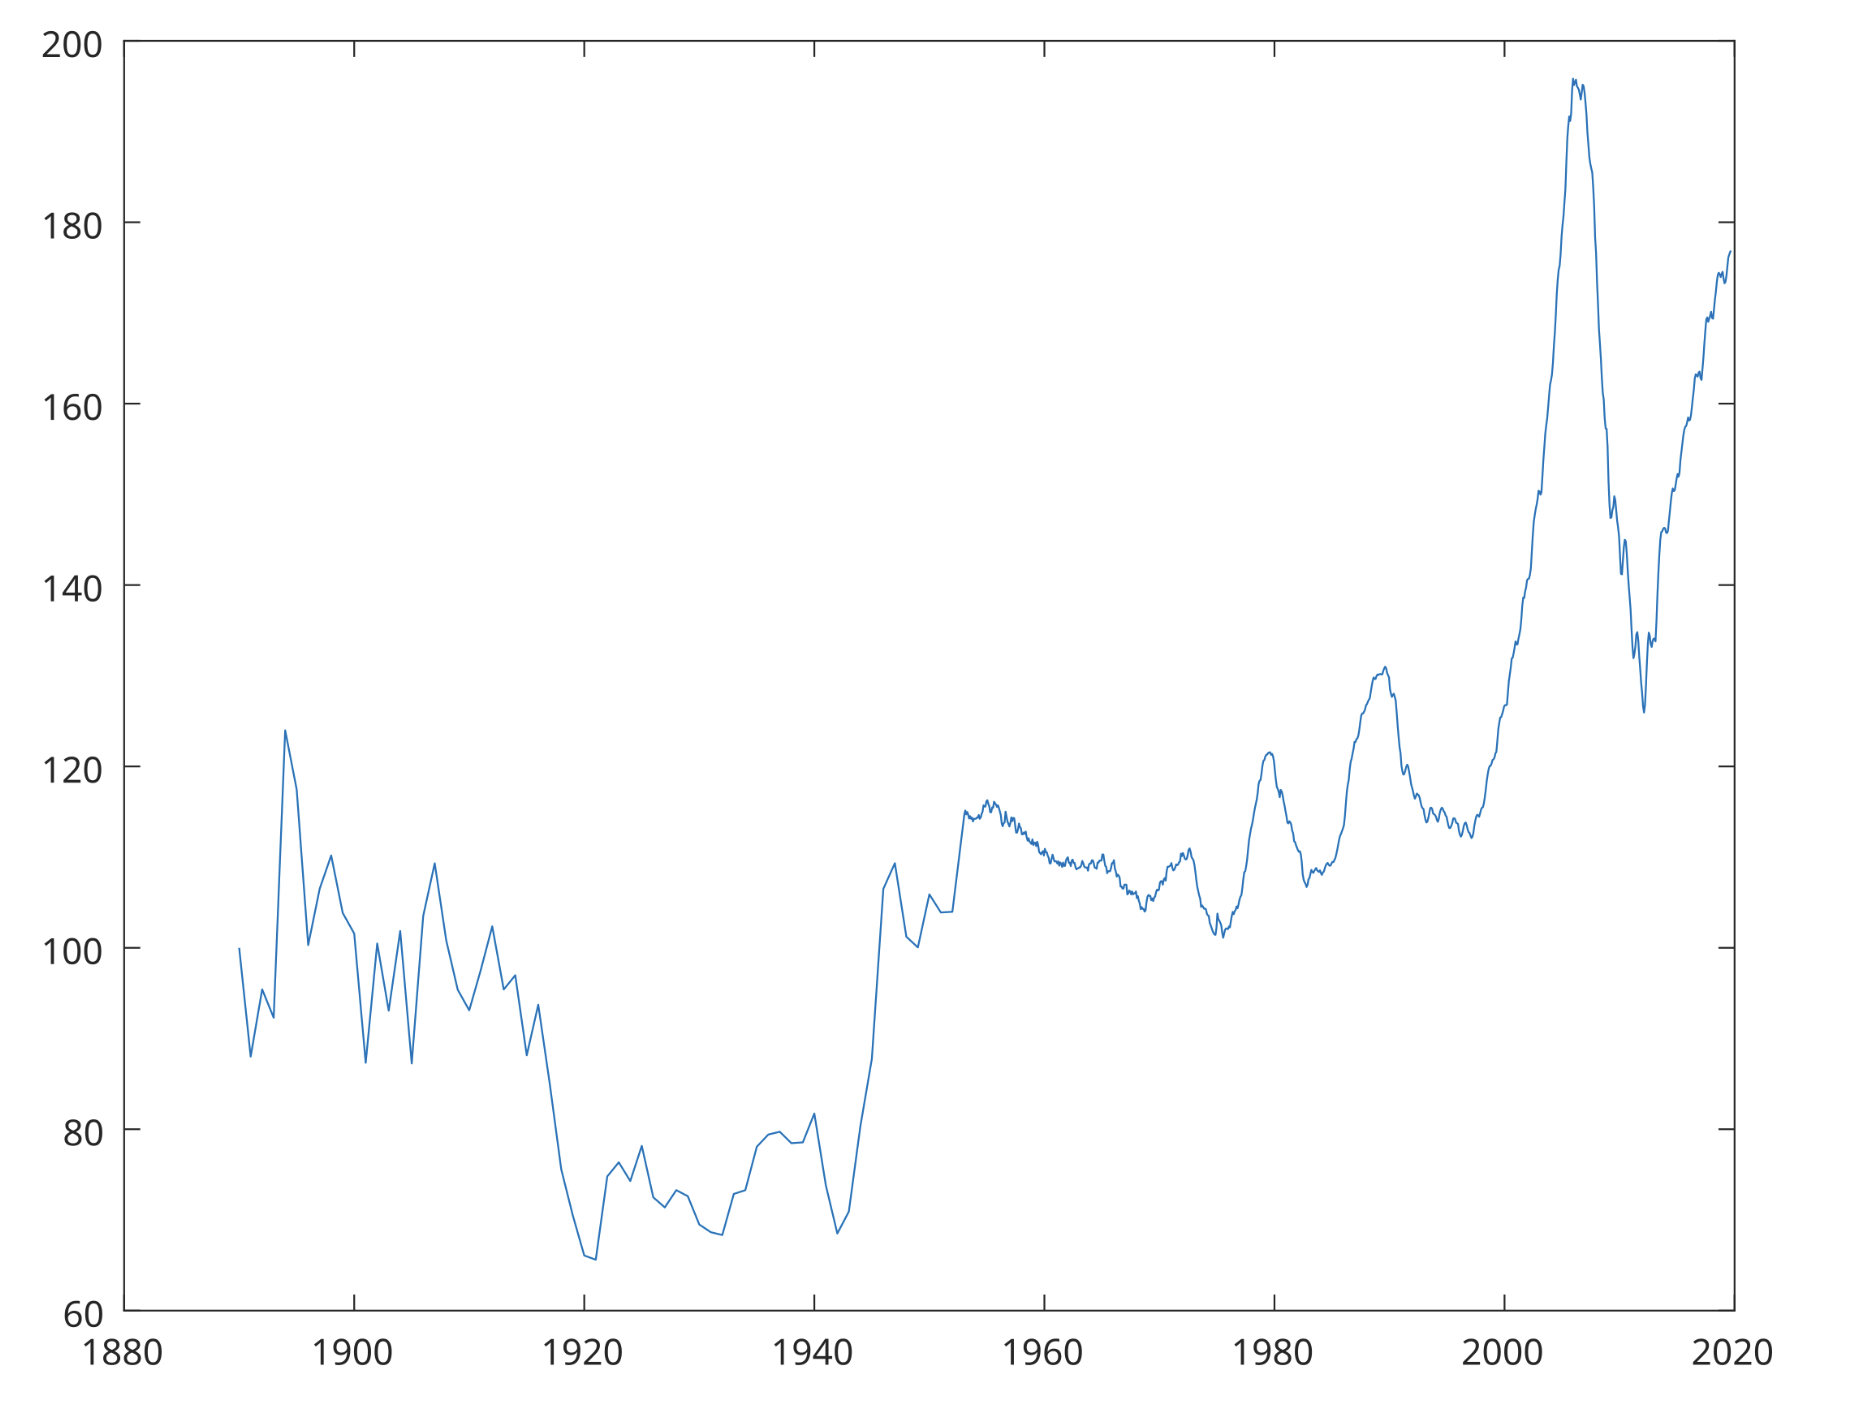
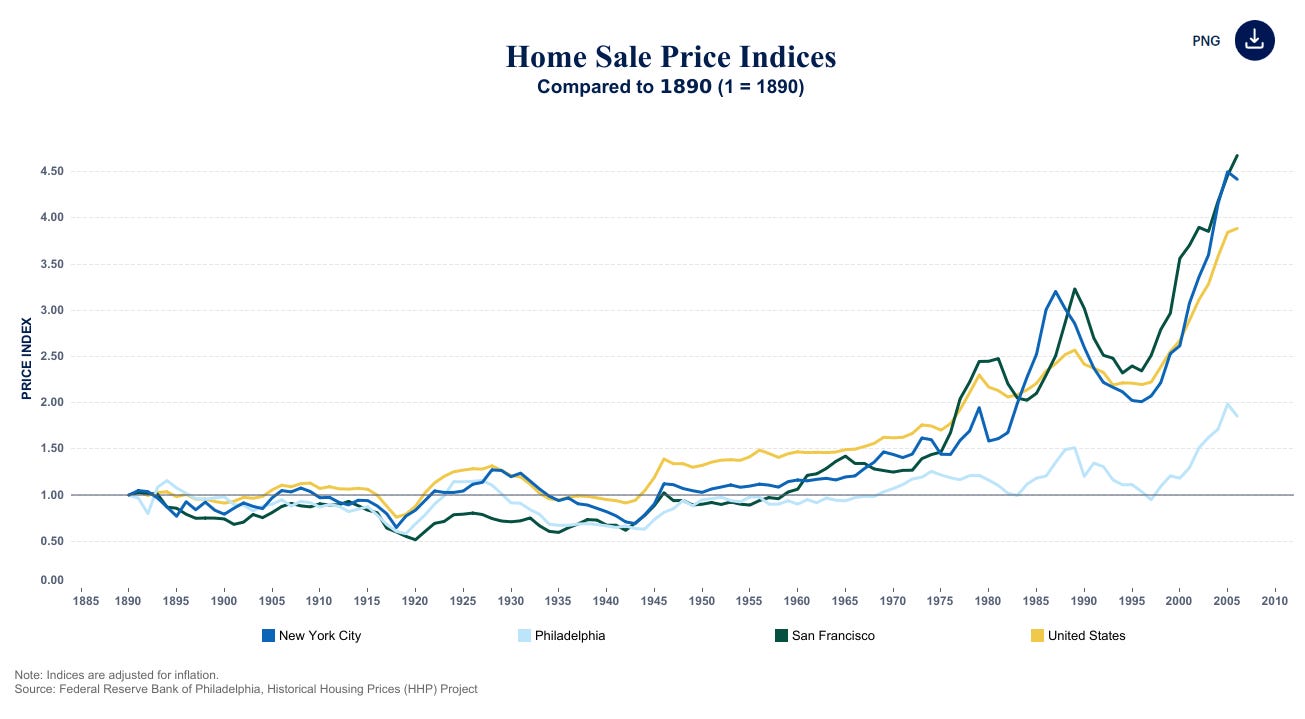
Case–Shiller home price index data, inflation adjusted, 1890–2018.
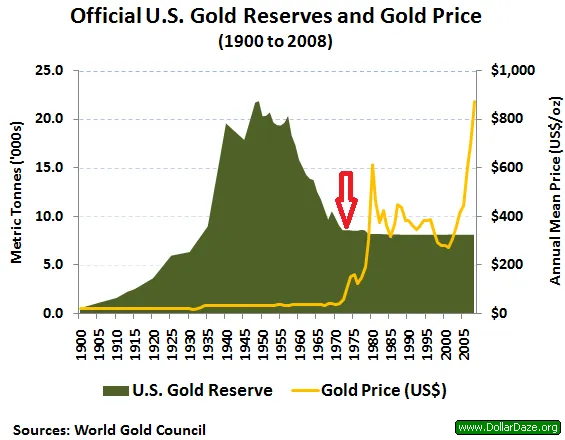
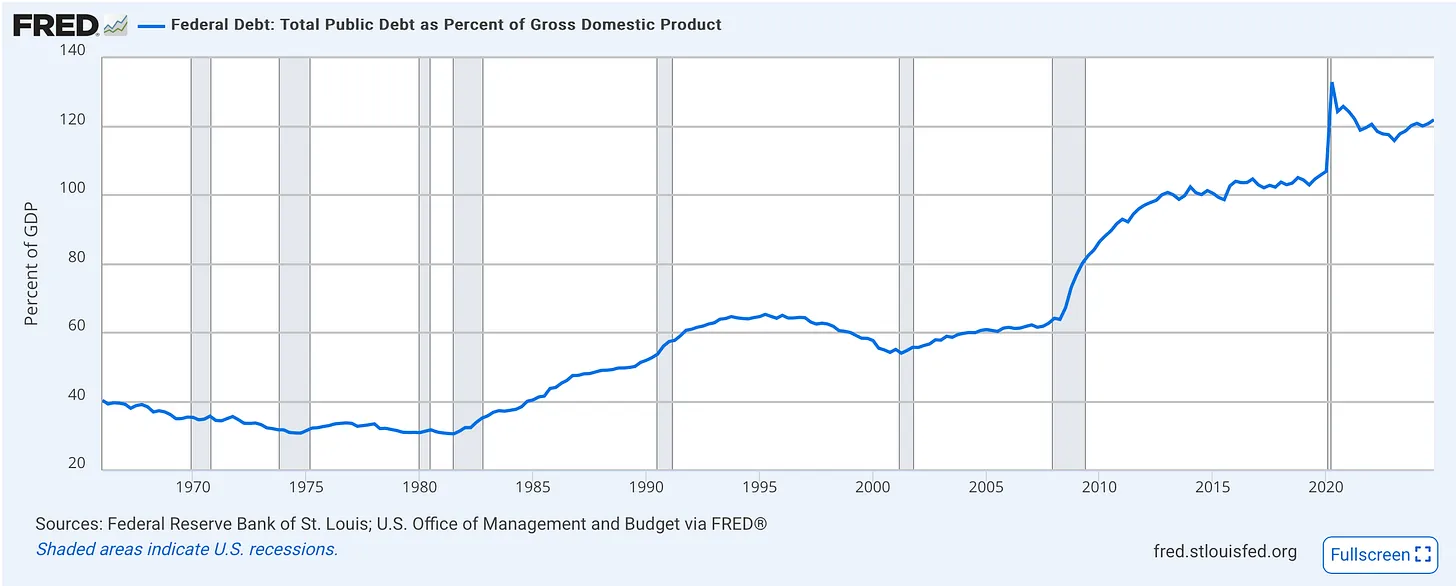
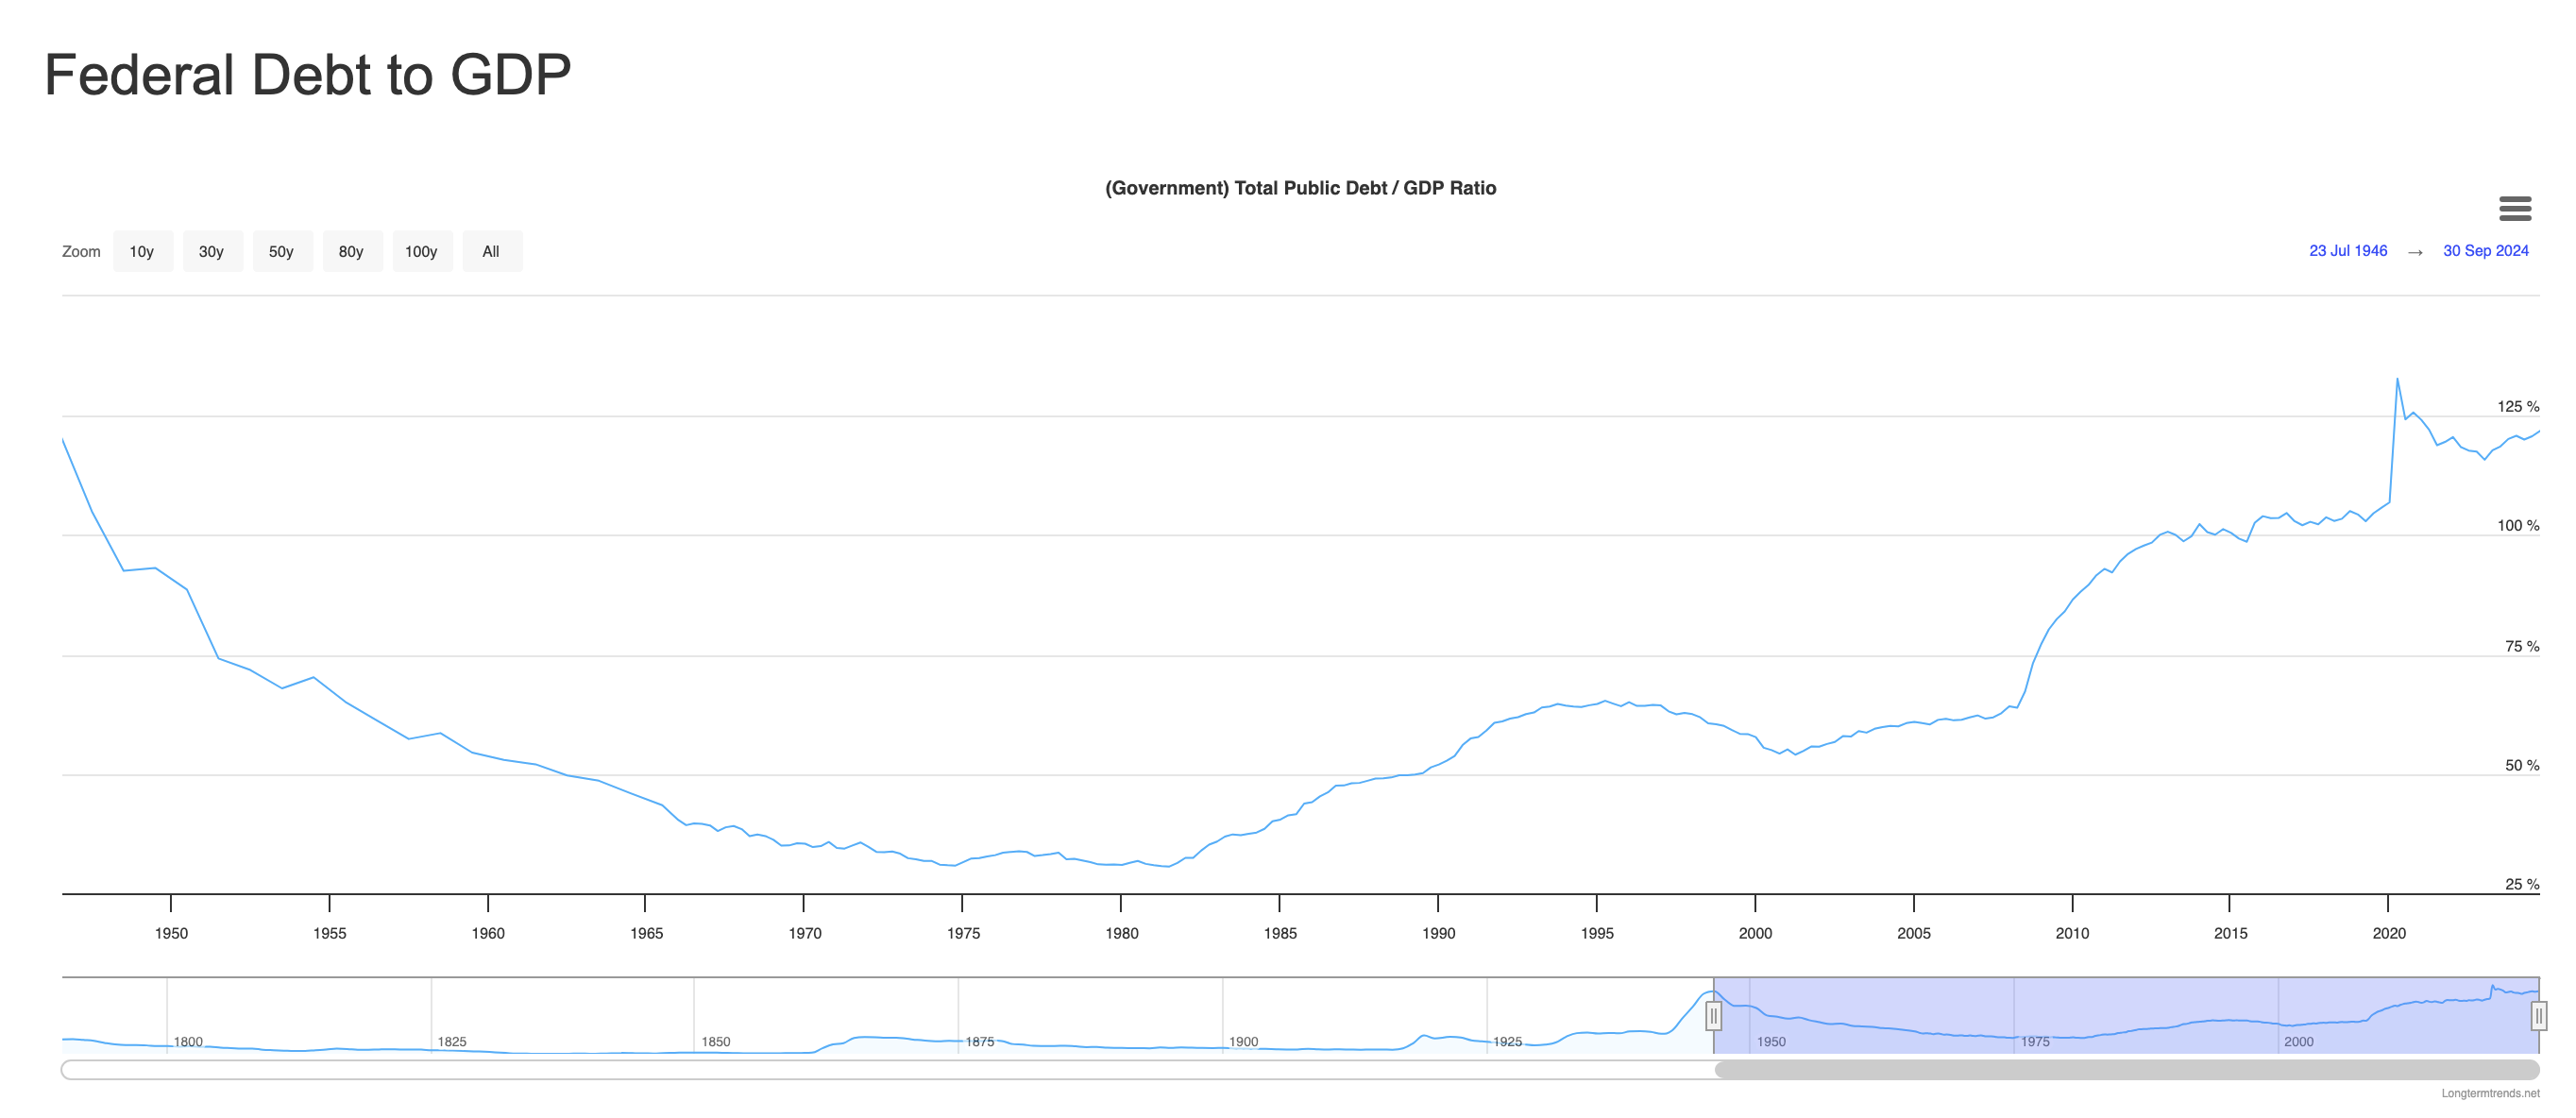
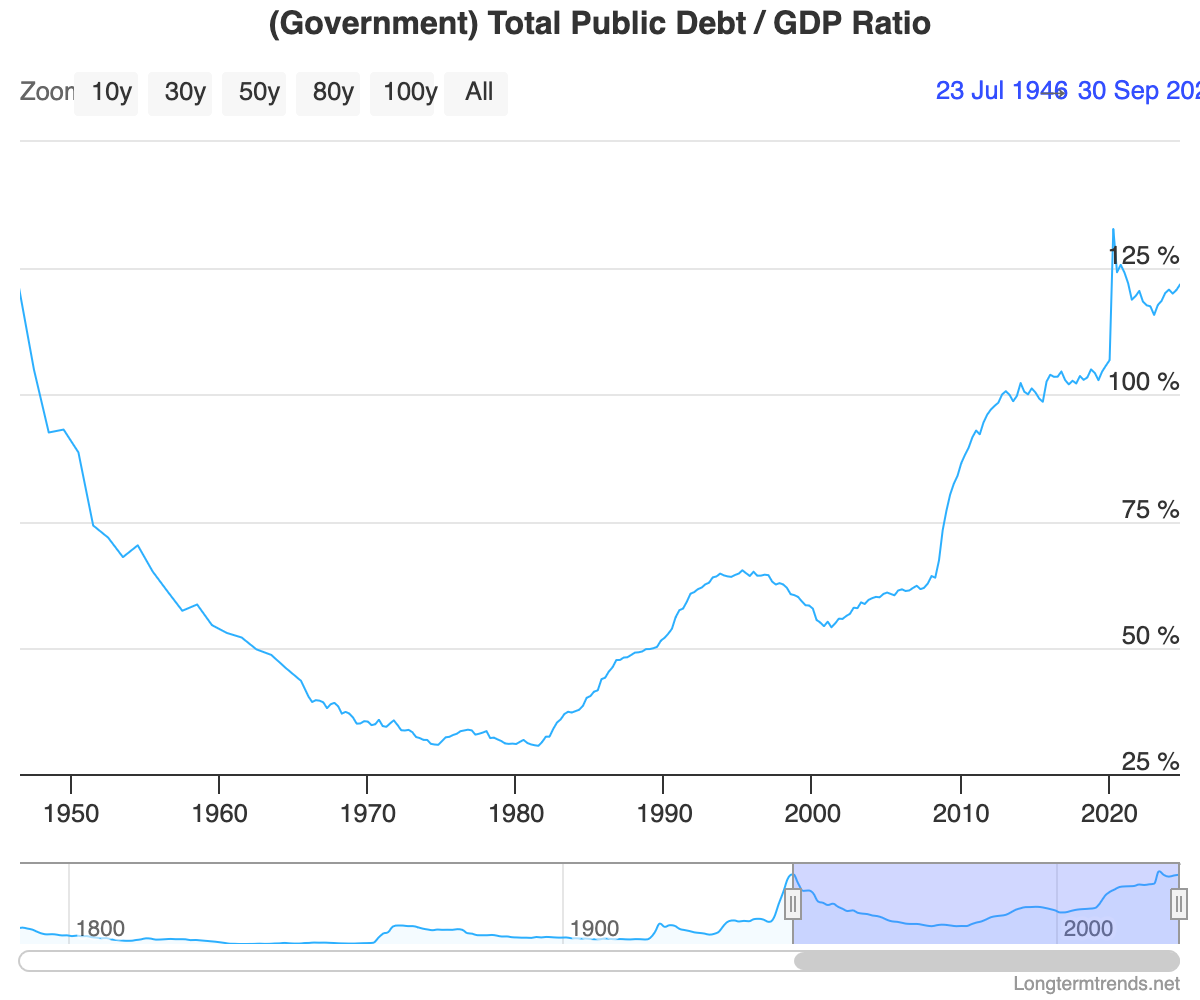
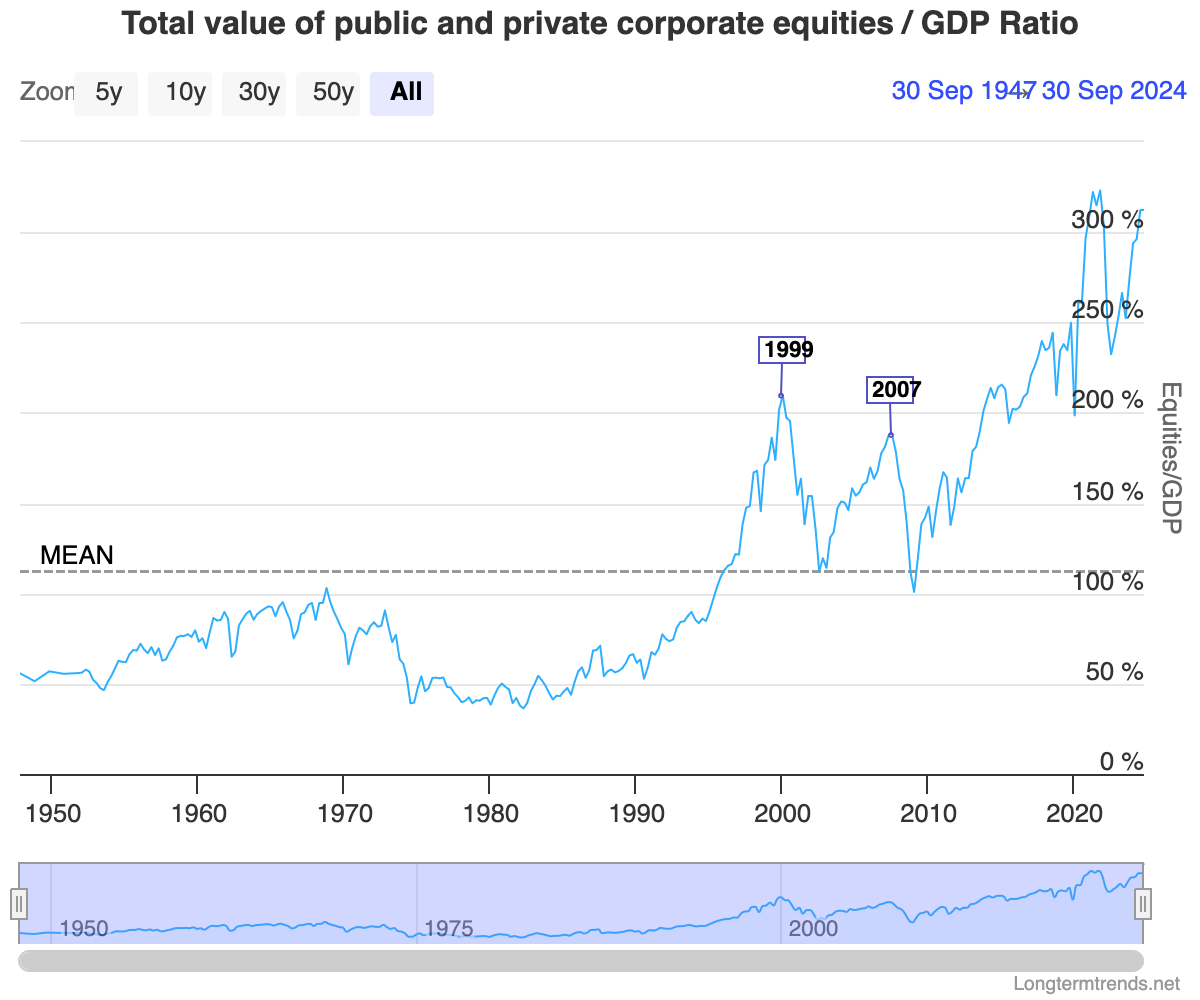
50% of GDP to 300%???

industrial era left, financial era right
1972 was the last man on moon
The Club of Rome published The Limits to Growth in 1972, arguing that exponential economic and population growth would eventually collide with finite resources.
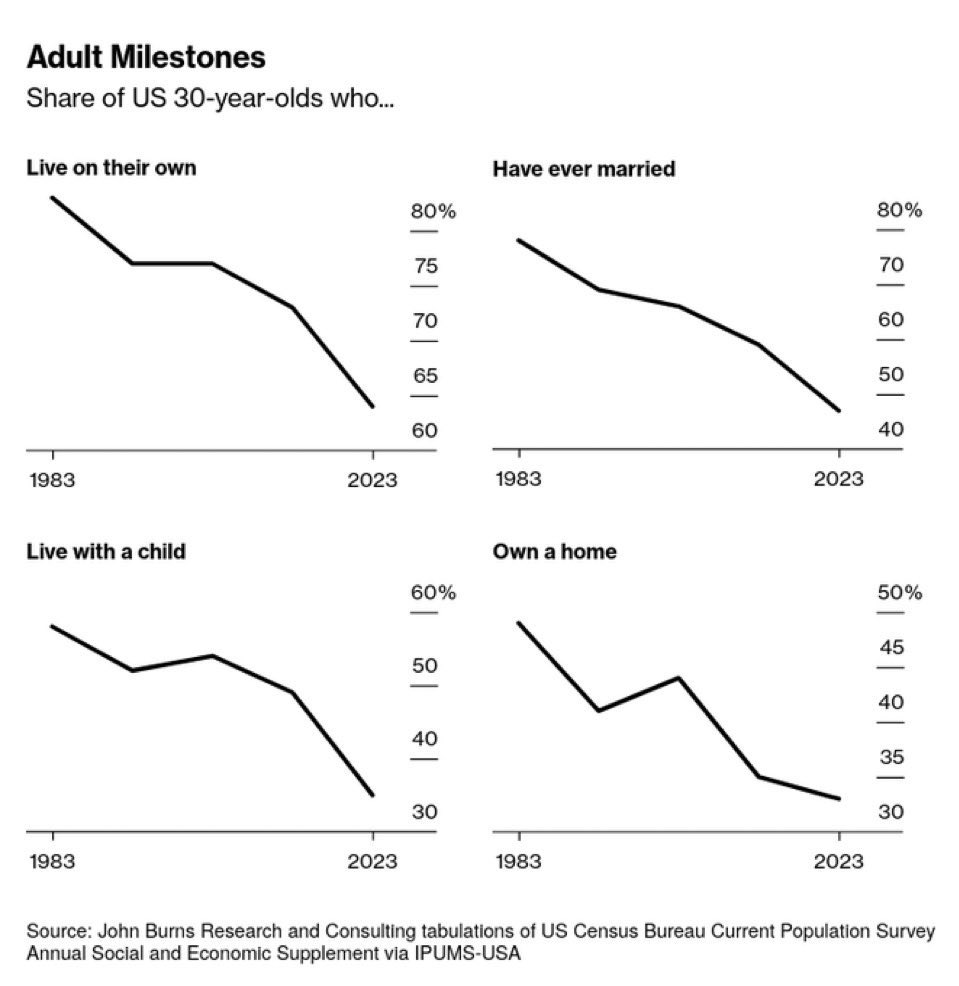
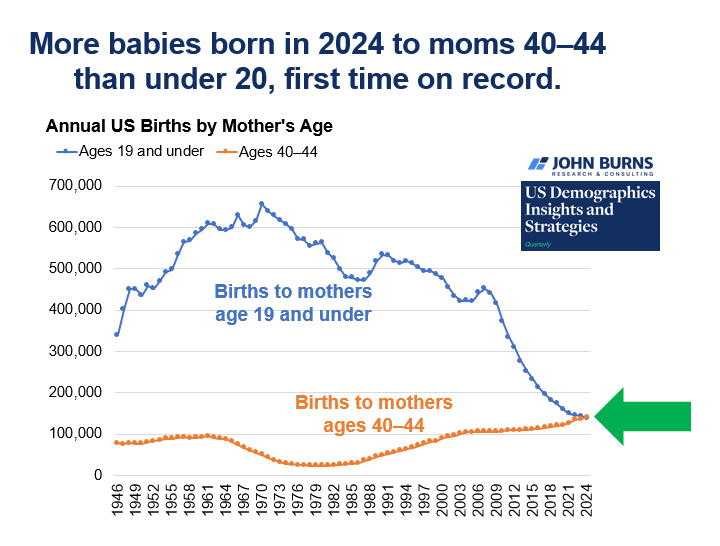
https://archive.is/20240919114242/https://www.bloomberg.com/news/articles/2024-09-10/us-economy-is-reshaped-by-covid-fueled-dating-recession

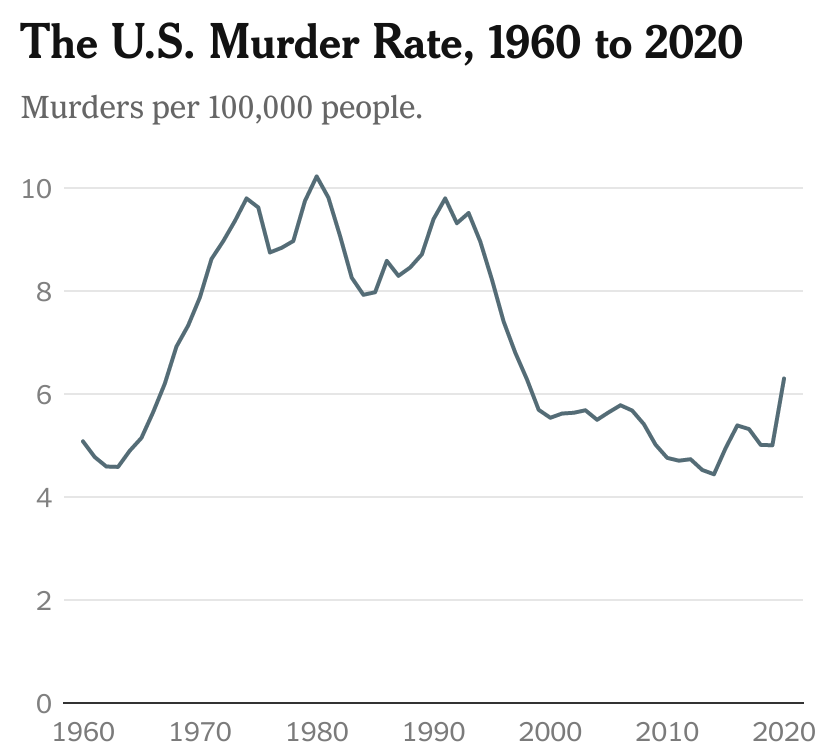
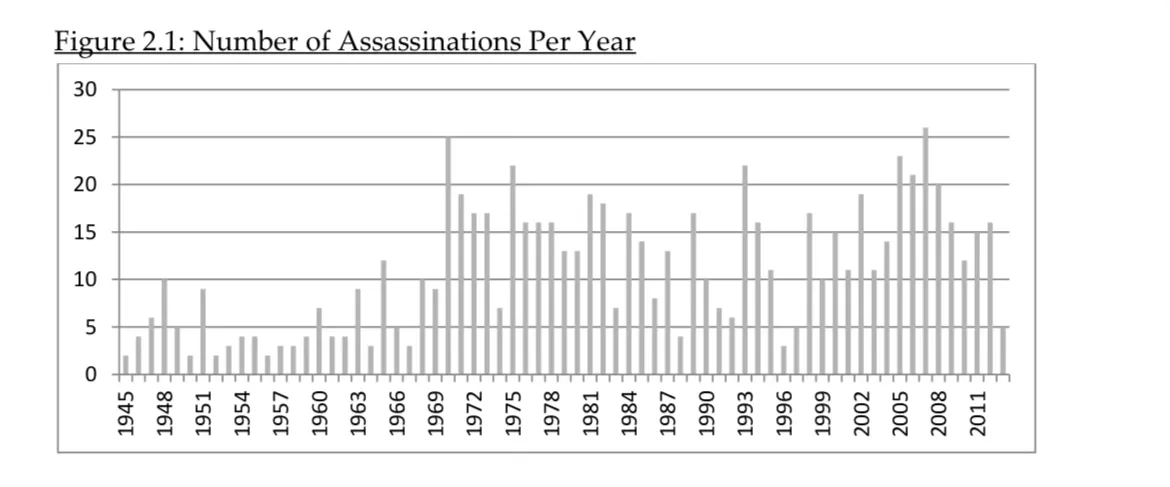
no more crazy 60s political bombing assassinations etc(things are wayyyy better) and plane hijackings
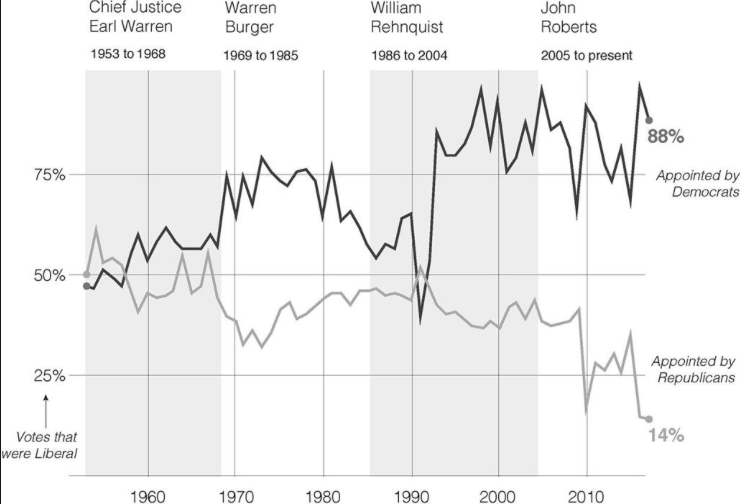
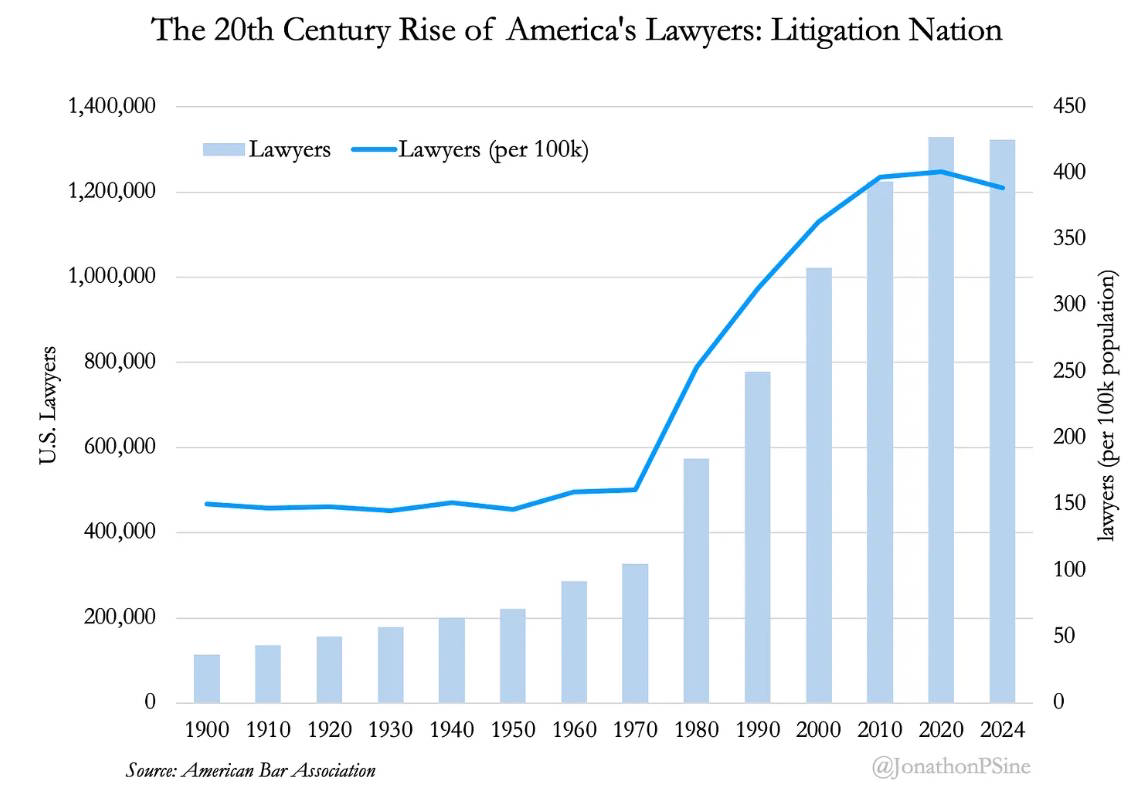
judges votes on issues and the president that appointed them ““In an analysis published after Justice Anthony Kennedy retired, law professors Lee Epstein and Eric Posner wrote in the New York Times that in the ’50s and ’60s, “the ideological biases of Republican appointees and Democratic appointees were relatively modest.”13 Even as late as the ’90s, justices regularly voted in “ideologically unpredictable ways.” In the 1991 term, for instance, Byron White, a Democratic appointee, “voted more conservatively than all but two of the Republican appointees, Antonin Scalia and William Rehnquist.” But that’s changed. Over the past decade, “justices have hardly ever voted against the ideology of the president who appointed them,” Epstein and Posner find. “Only Justice Kennedy, named to the court by Ronald Reagan, did so with any regularity.” Their chart is striking:””
Based Israel


What could all this possibly be if not energy, nothing else is fundamental enough

proxy for rust belt stagnation


😭
https://substack.com/home/post/p-167757436?source=queue
“After the 1970s, Americans pulled back from just about every form of socializing. By the late 1990s, the share of Americans who said they visited the homes of friends in the previous week had declined by more than 40 percent. “Visits with friends are now on the social capital endangered species list,” Putnam wrote. And all this happened by 2000, before the real anti-social century even started.”
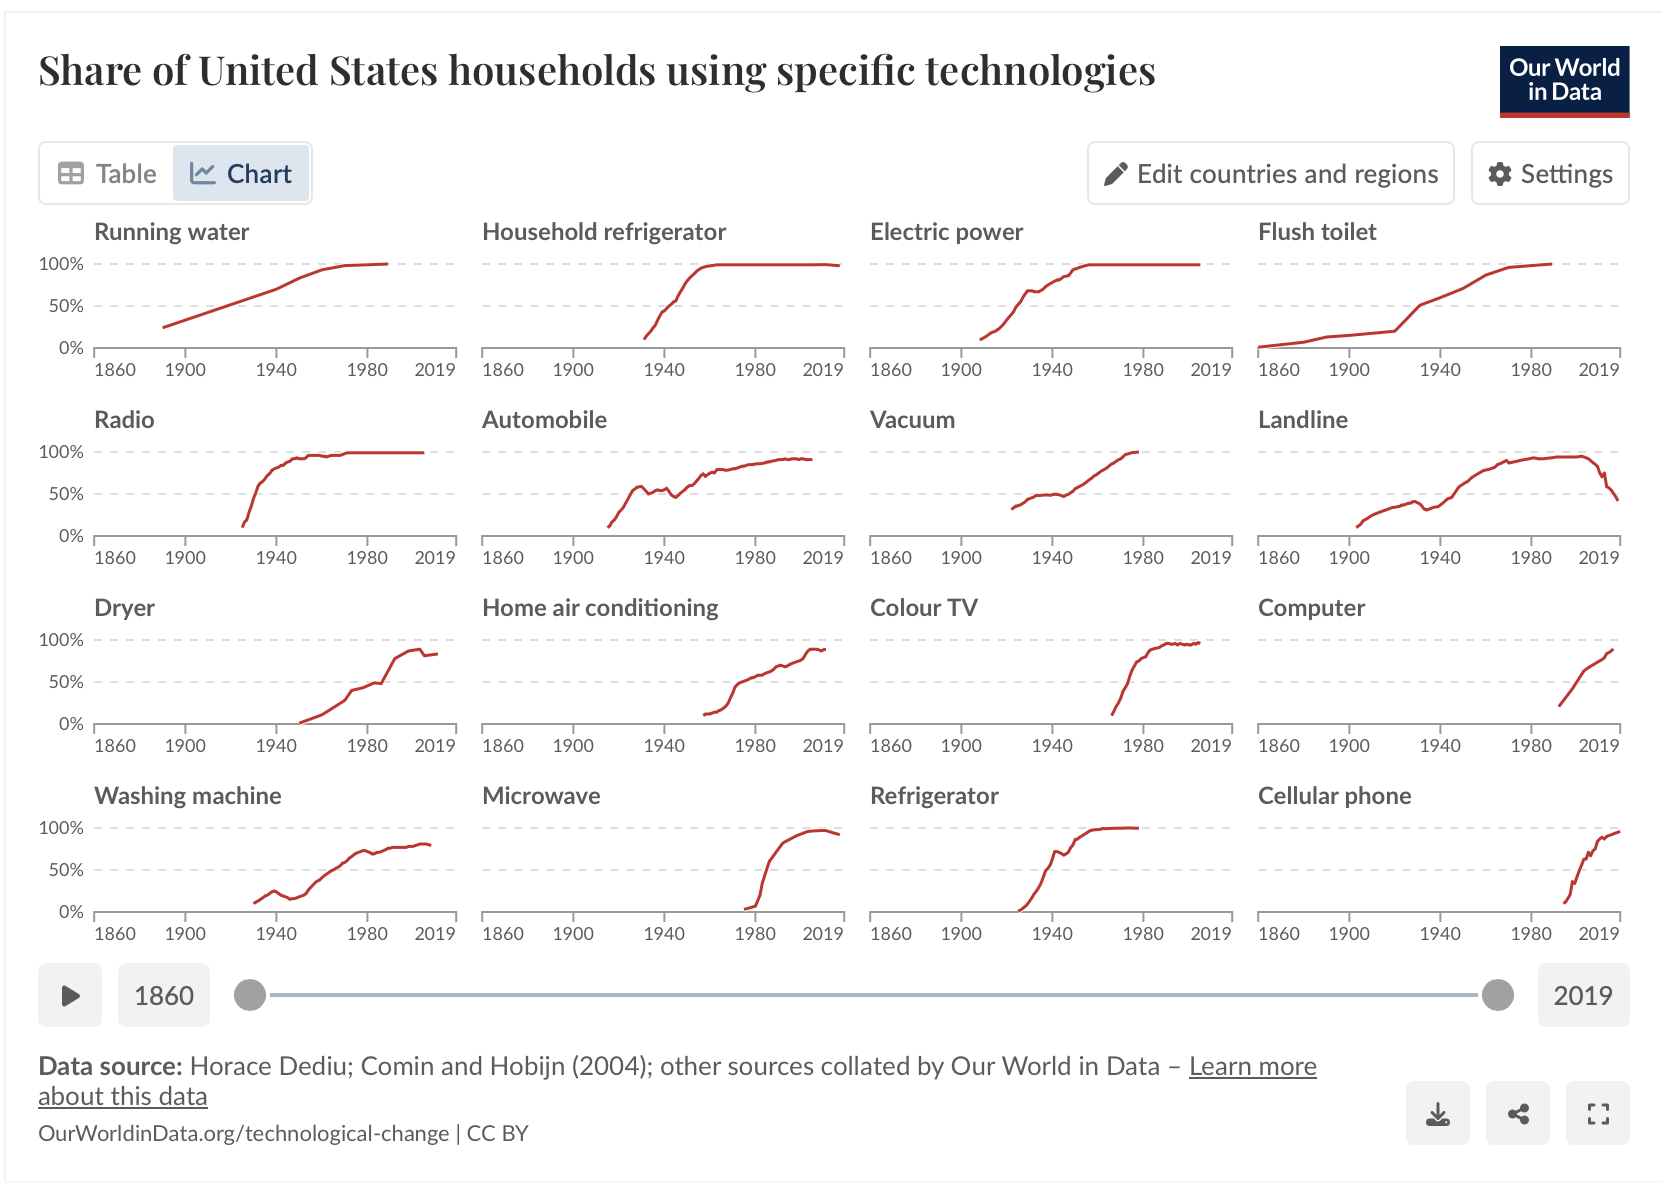
why no new appliances
https://chatgpt.com/s/t_687e58a94f9c8191bf5c62c70d24fbed
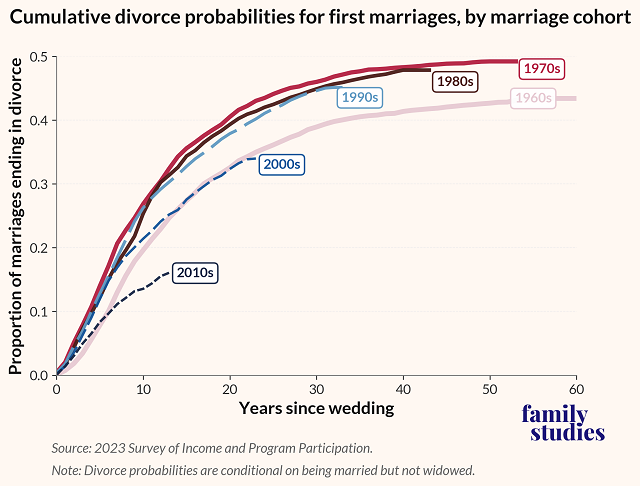
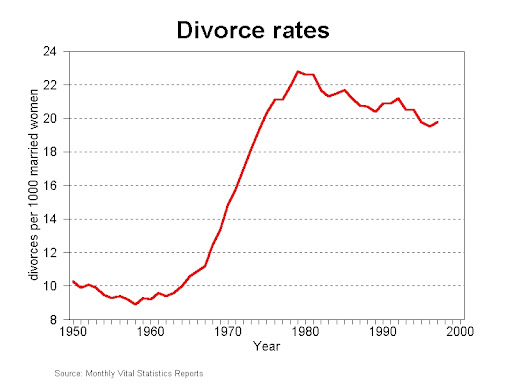
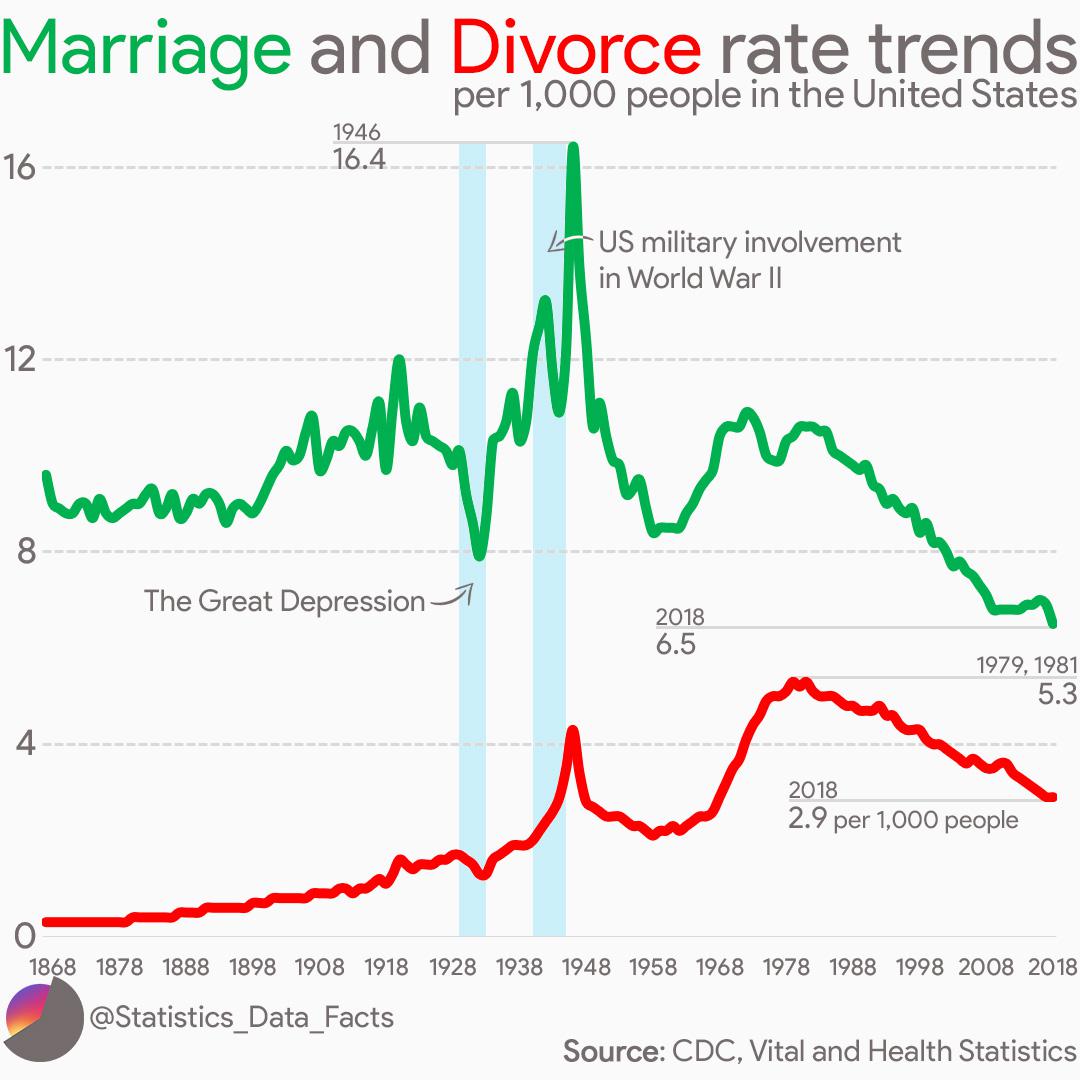
peak divorce rate?
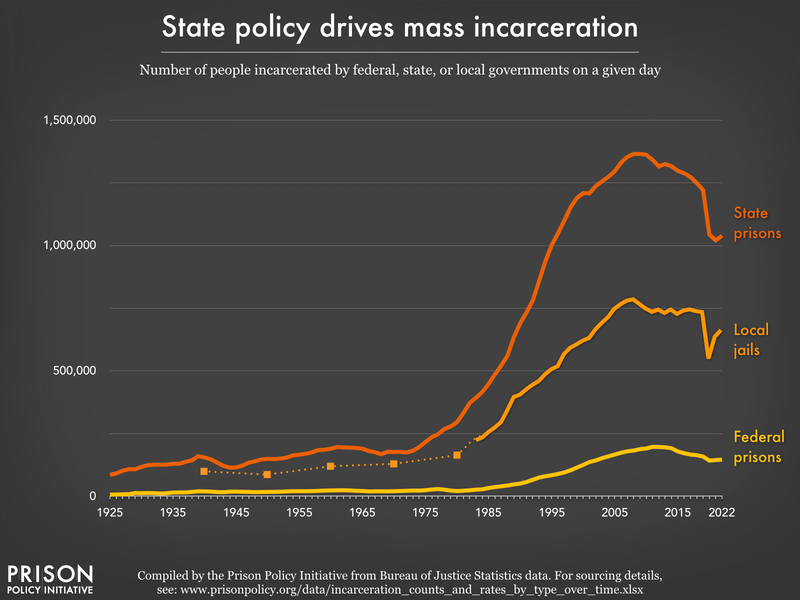
Boomers in their teens and 20s commit crimes. There are more crime age men during this period than before or after
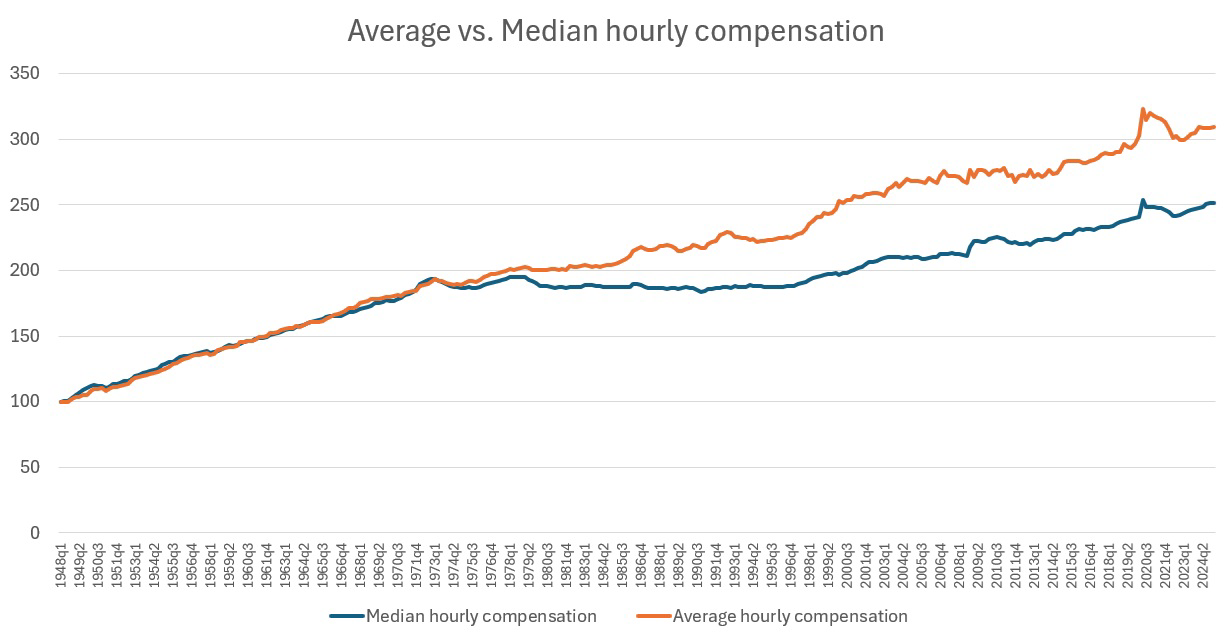
So productivity growth halved. AND average income decoupled from it. AND median income decoupled from the average.
Idk man. But this plus immigration plus boomers getting to working age? Would certainly give labor less market power.
https://fred.stlouisfed.org/graph/?g=1J7yr This is actually pretty wild how dramatic that bubble is.
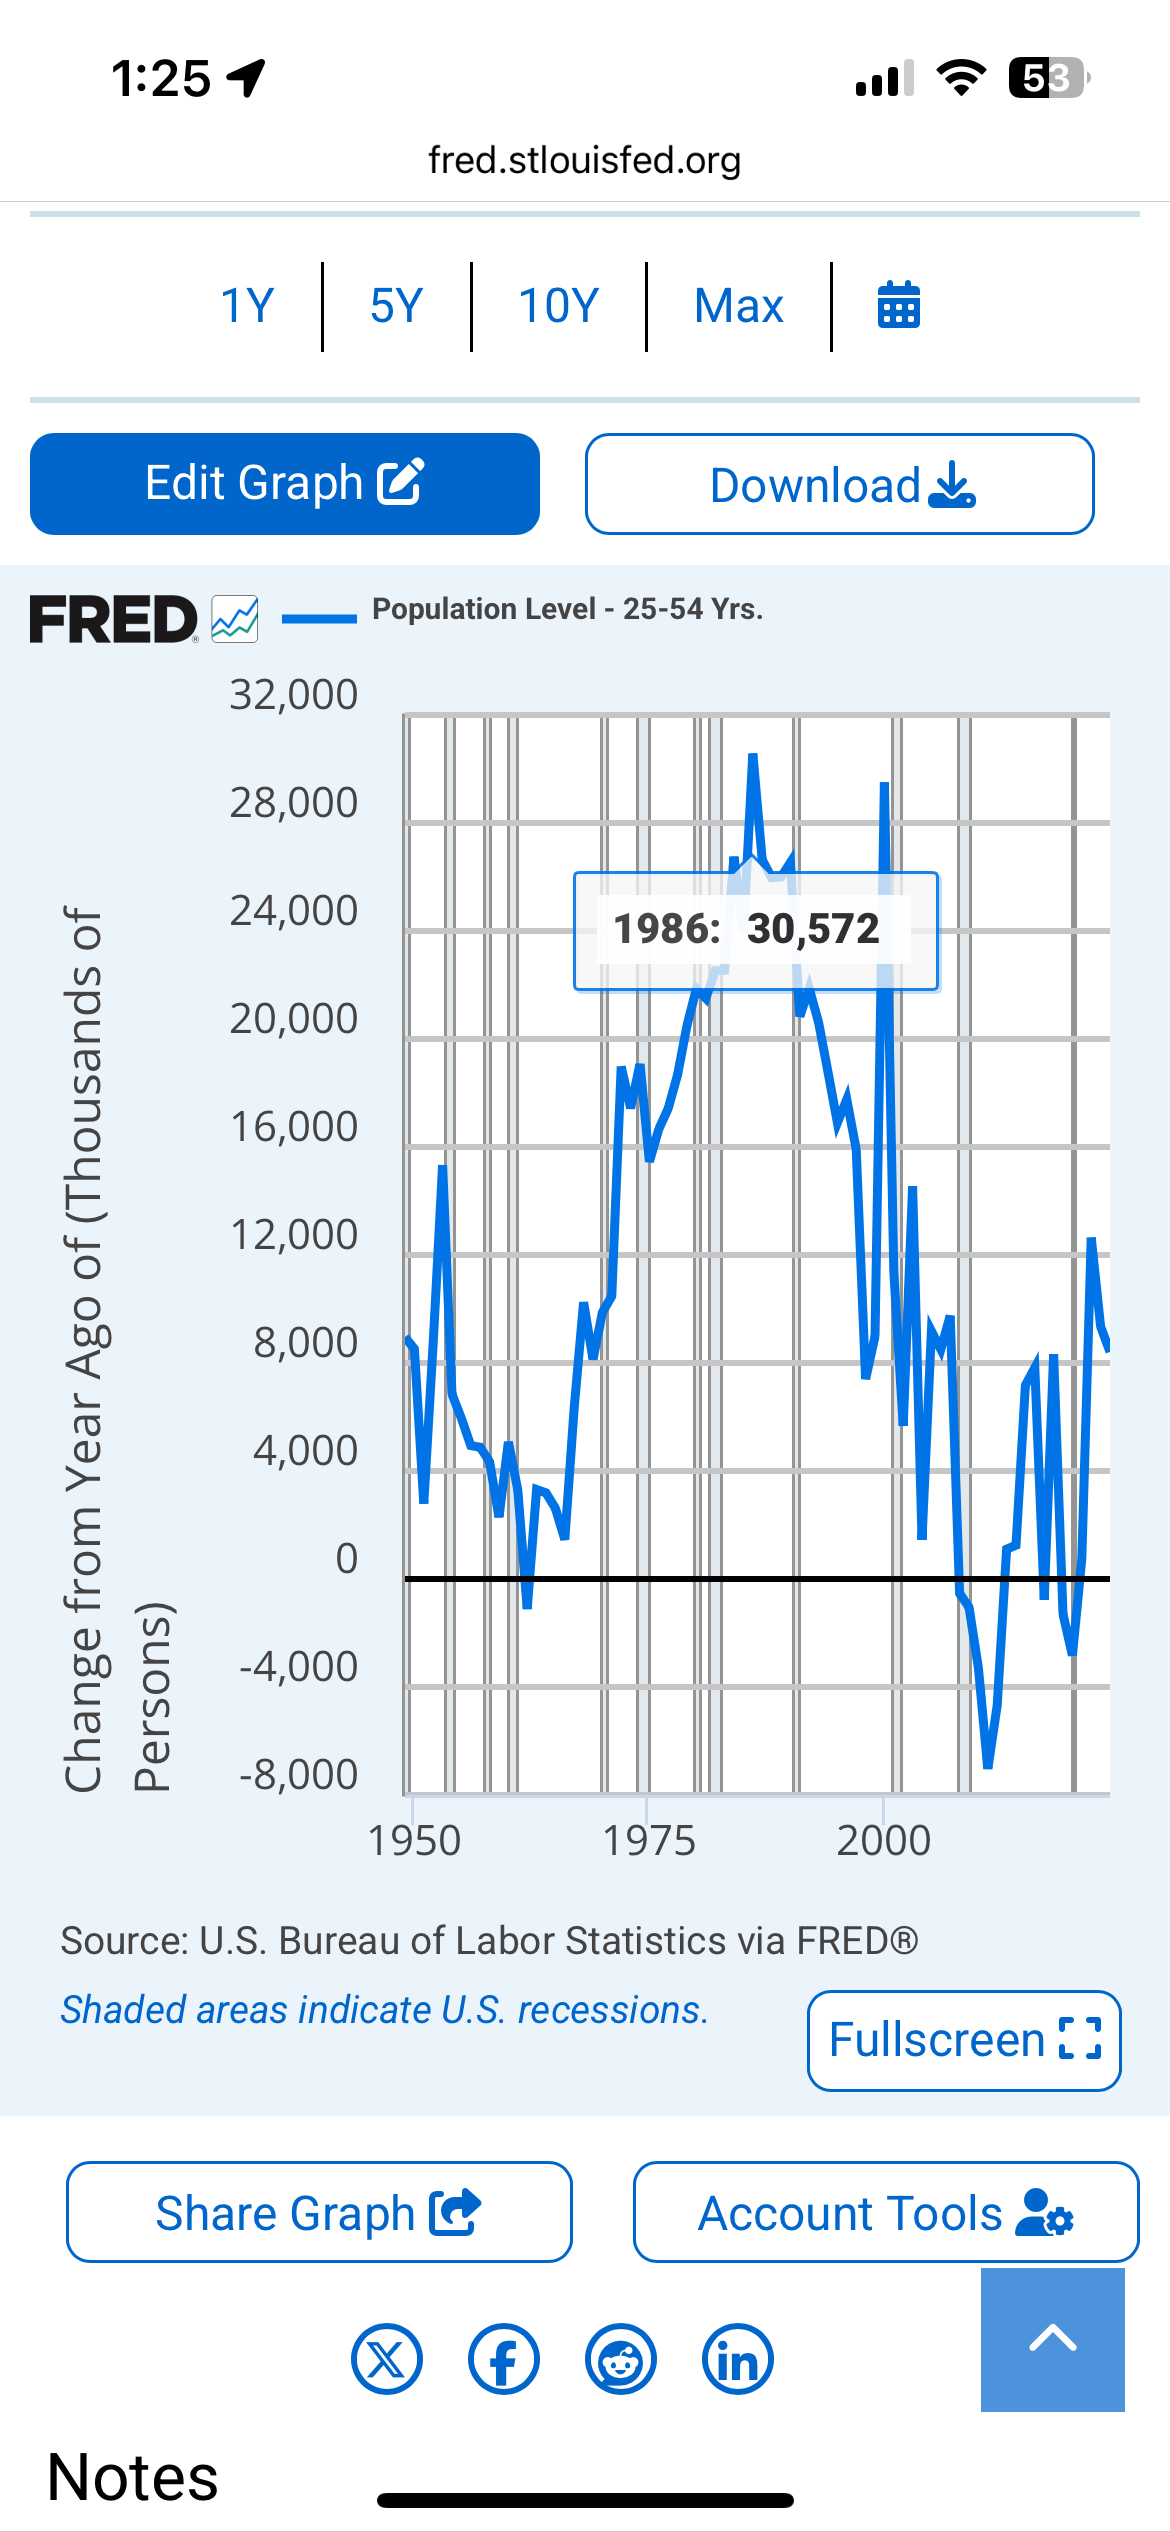
Periods of American median prosperity (50s/60s and 90s) being a negative second derivative of labor force size? Lines up with European Black Death for intuition. It’s like a reverse demographic dividend which is what makes me doubt the theory. But obviously increasing labor supply pushes down wages.
But the 10s, despite vibes and the common consensus, had strong median wage growth without strong productivity growth and this was also peak immigration era. So explain that? But look at the numbers, smooth that data and that’s labor force addition similar to the 50s!
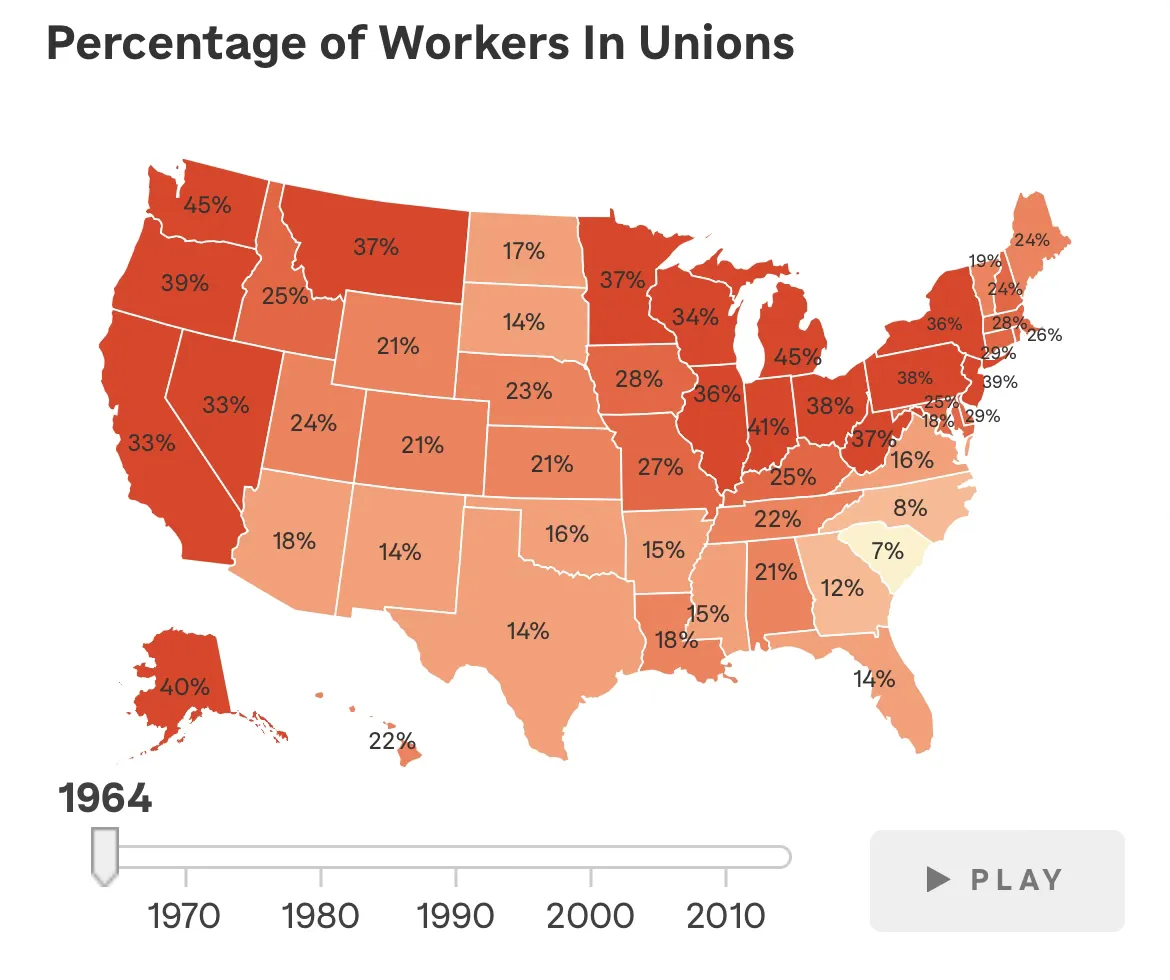
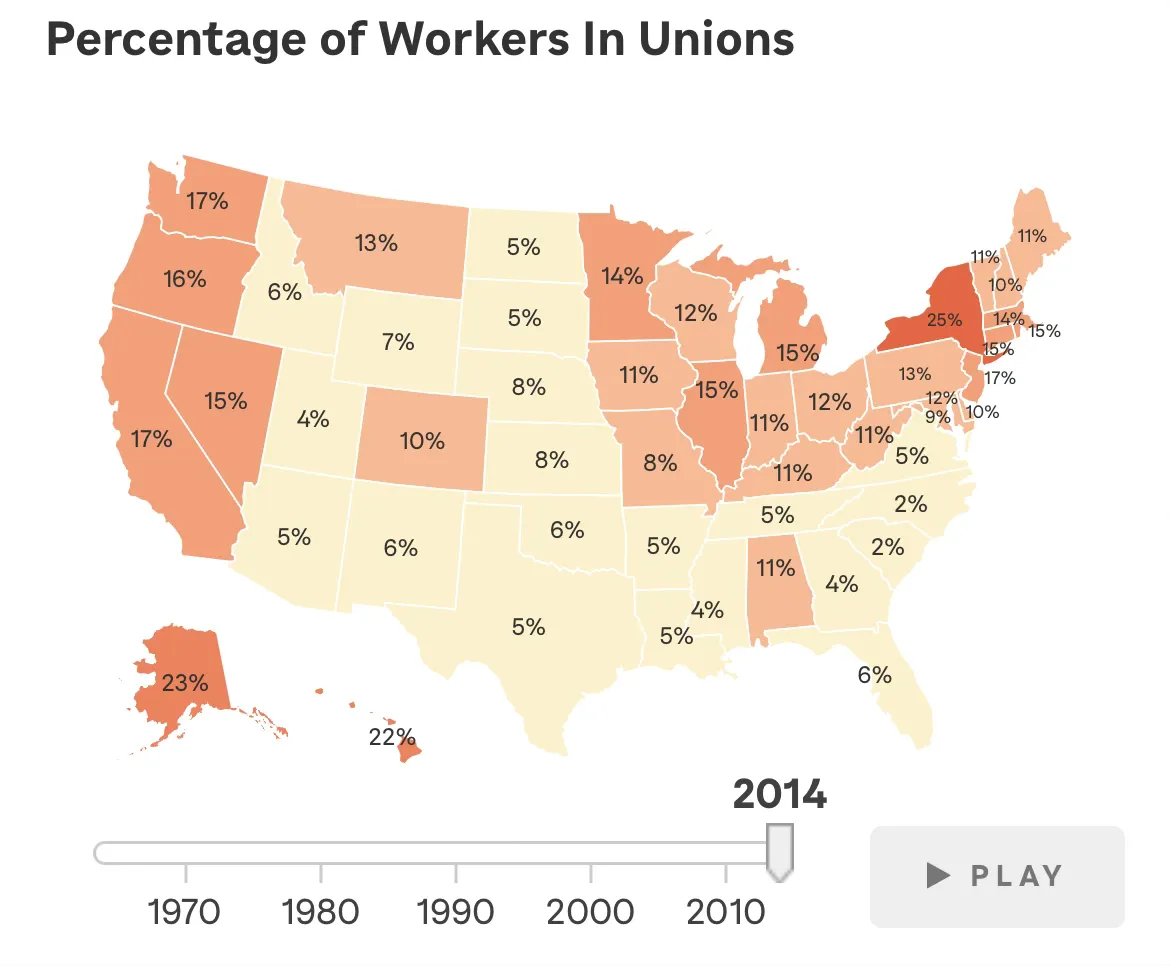
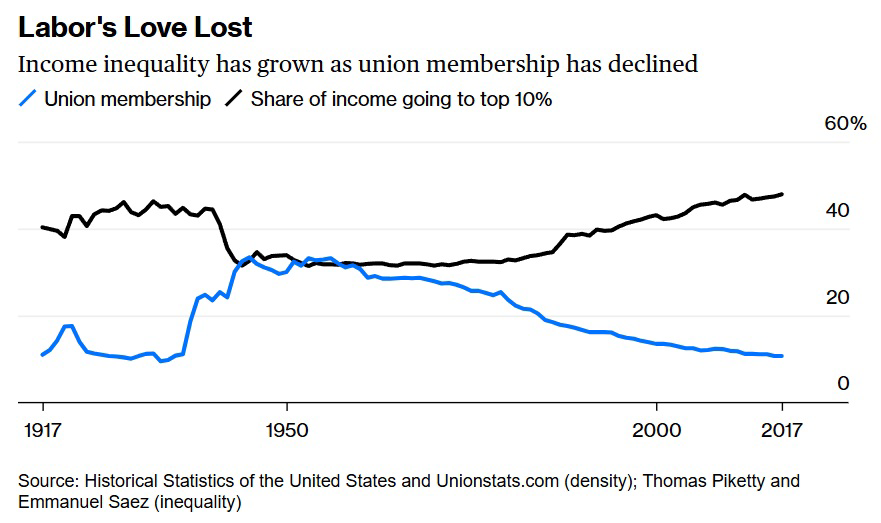
It’s just all about the bargaining power of labor. Labor force growth is one of the factors but so is unions, marginal elasticity of the labor vs capital, etc.
“Although we may not think of credit cards as a gender equality issue today, it wasn’t until 1974 that women were allowed to apply for and own a credit card in their name”
“Despite this opposition, Baird fought for five years until Eisenstadt v. Baird legalized birth control for all Americans on March 22, 1972.”
https://en.wikipedia.org/wiki/Lump_of_labour_fallacy?wprov=sfti1 Yes but market power
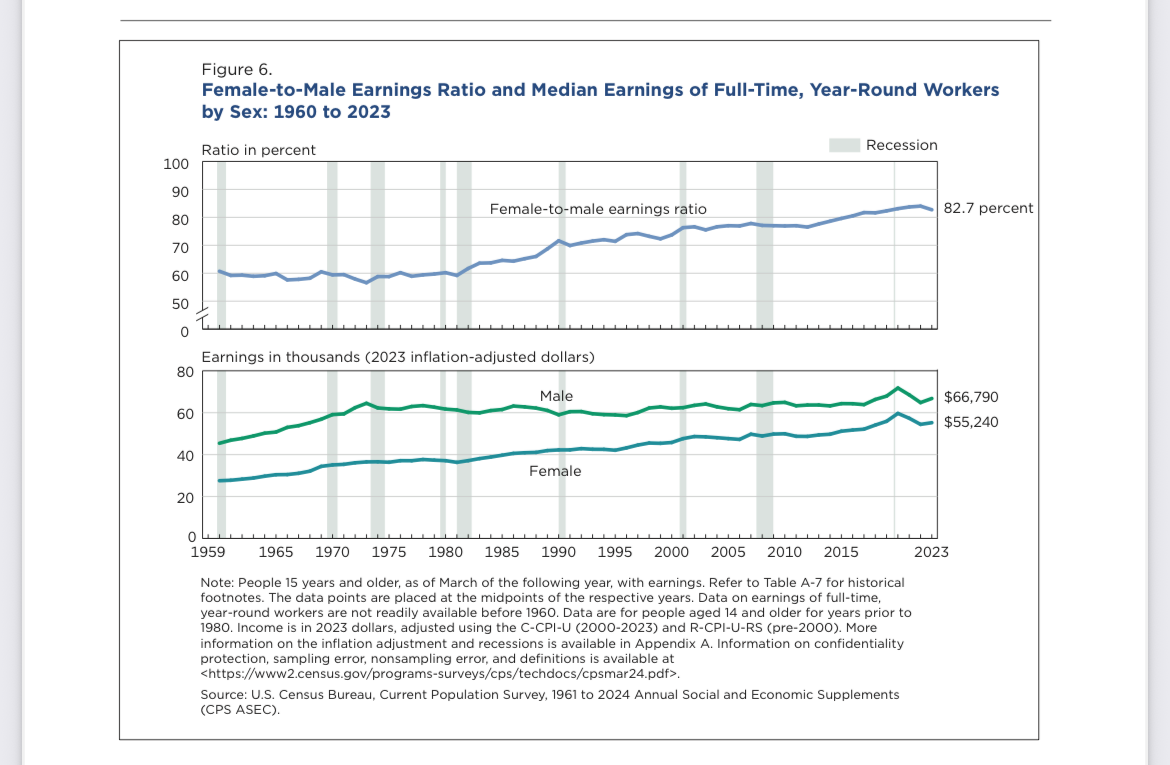
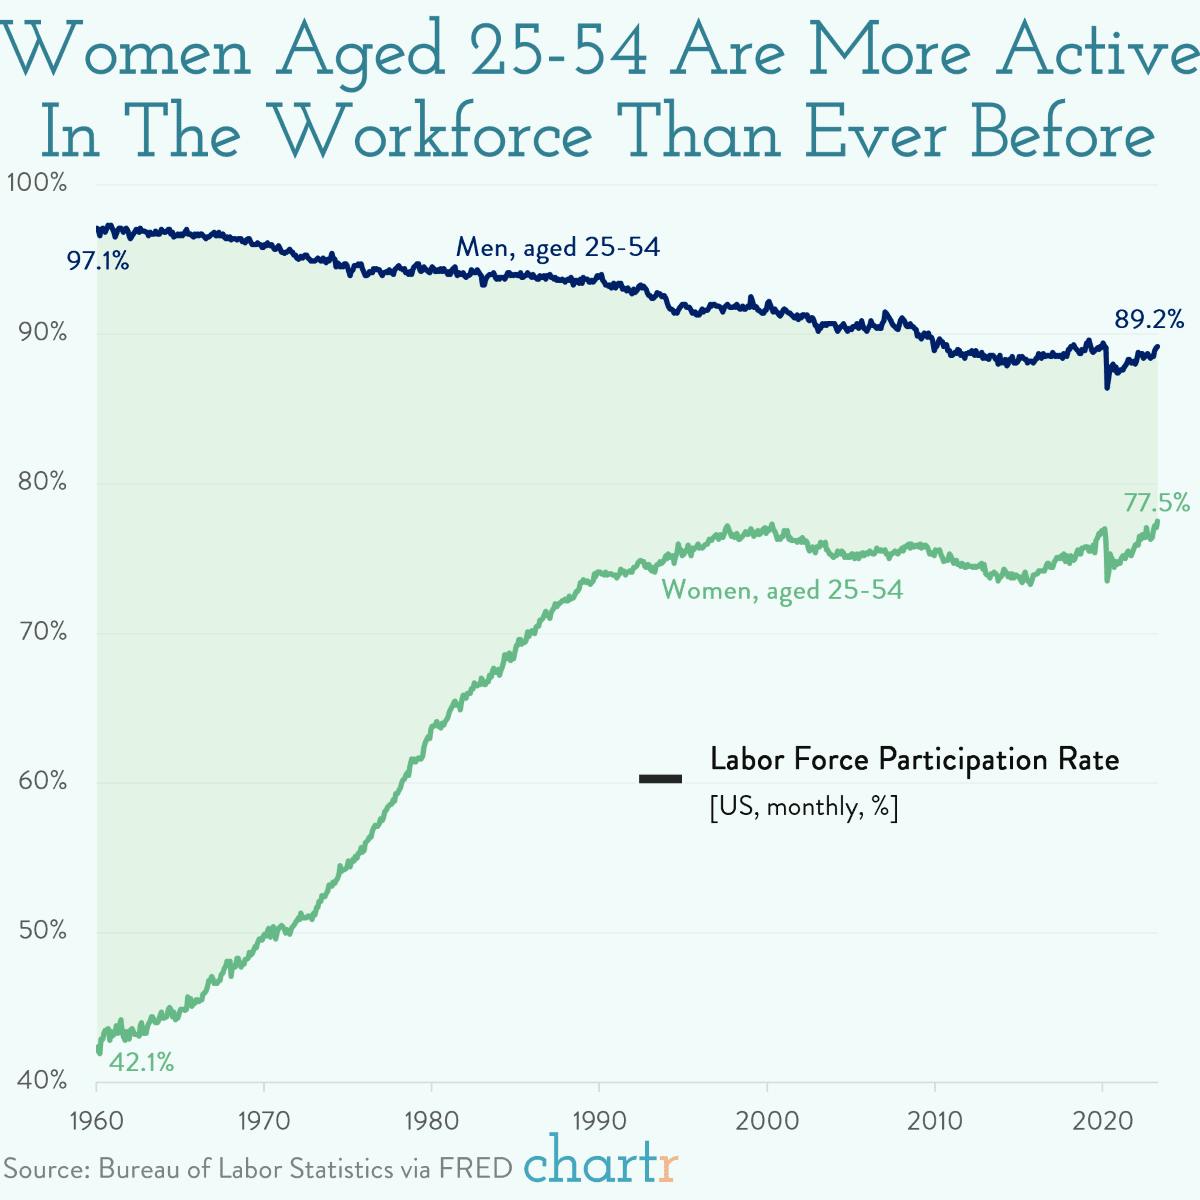
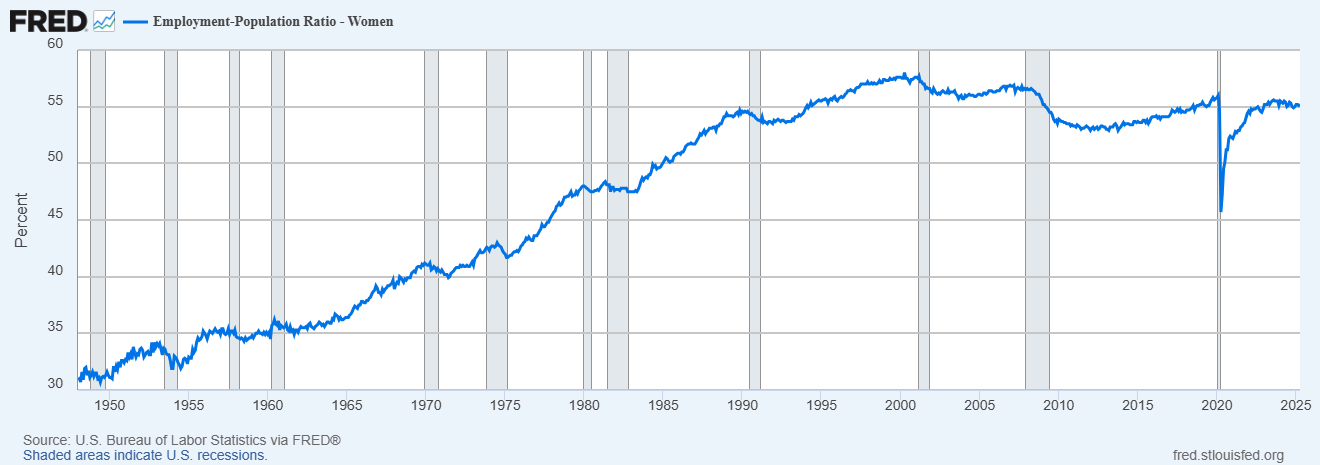
https://www.bls.gov/cps/demographics/women-labor-force.htm
https://equitablegrowth.org/womens-history-month-u-s-womens-labor-force-participation/
https://fred.stlouisfed.org/graph/?g=1J7Bd Participation rate too.
https://www.nber.org/digest/jun05/productivity-slowdown-1970s Read
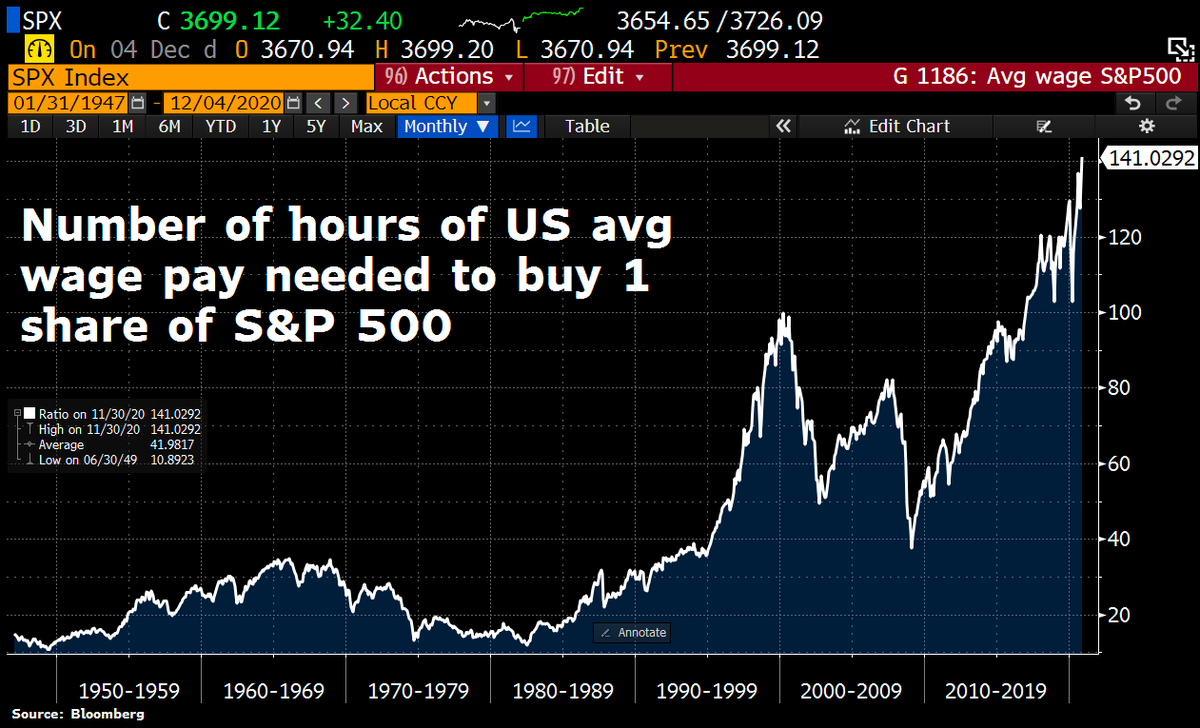
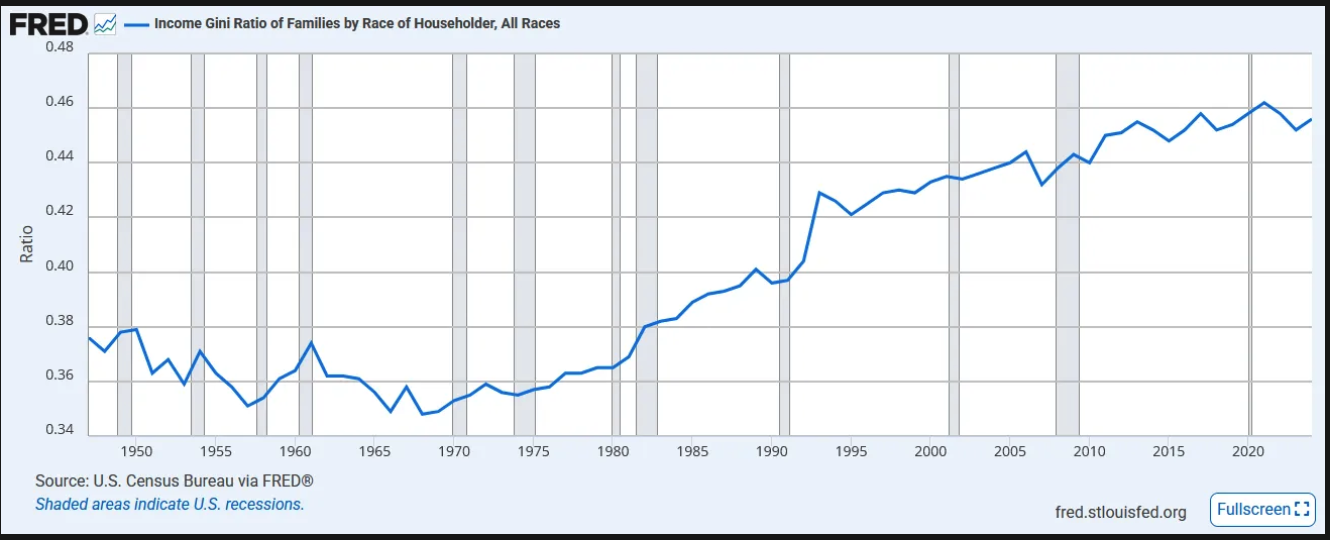
I want that ratio
Roe v wade 1973
Title 9 1972

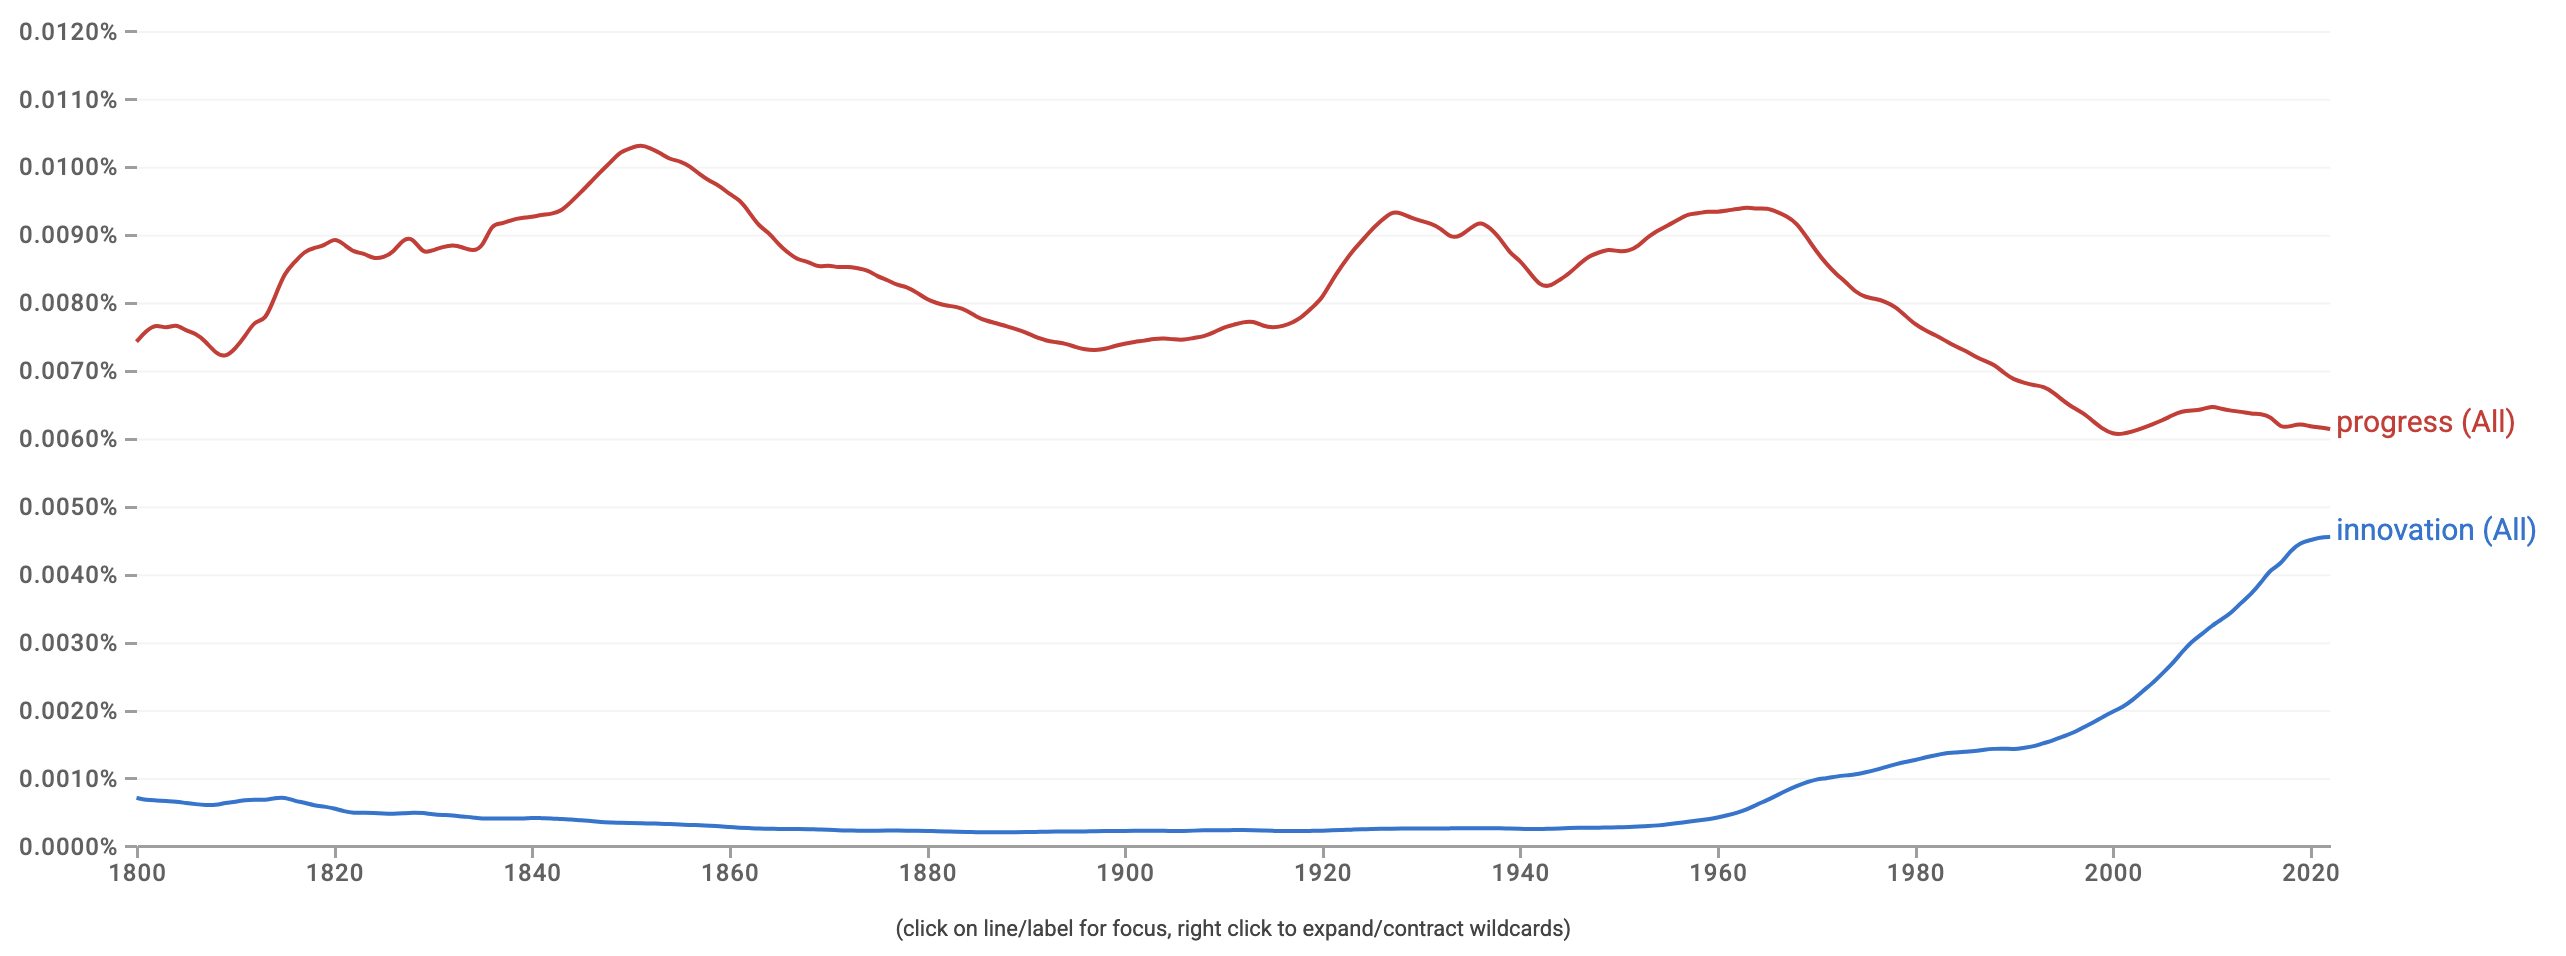
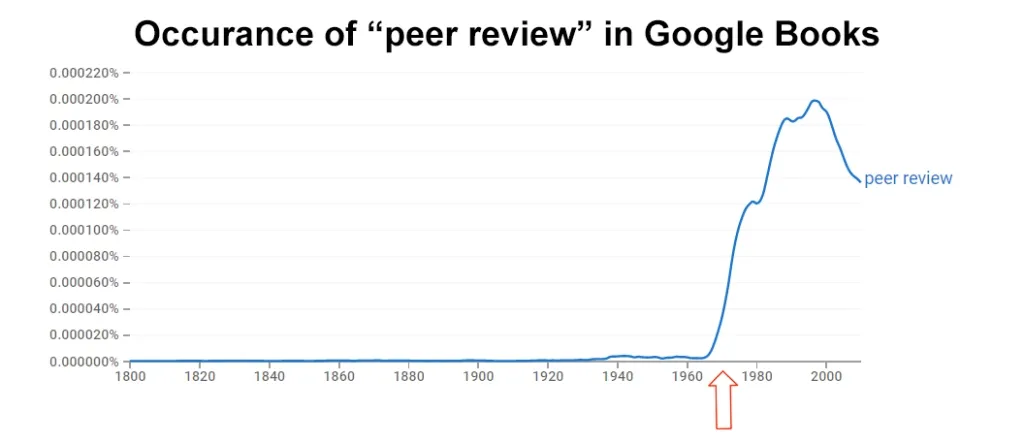
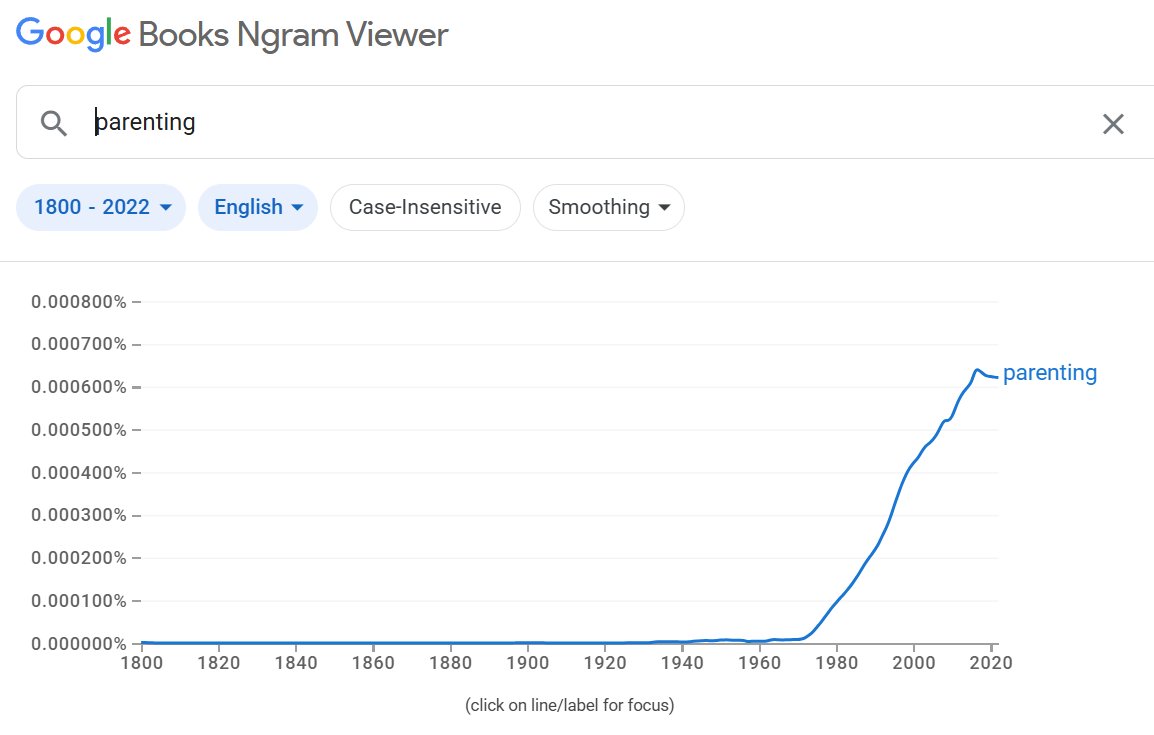
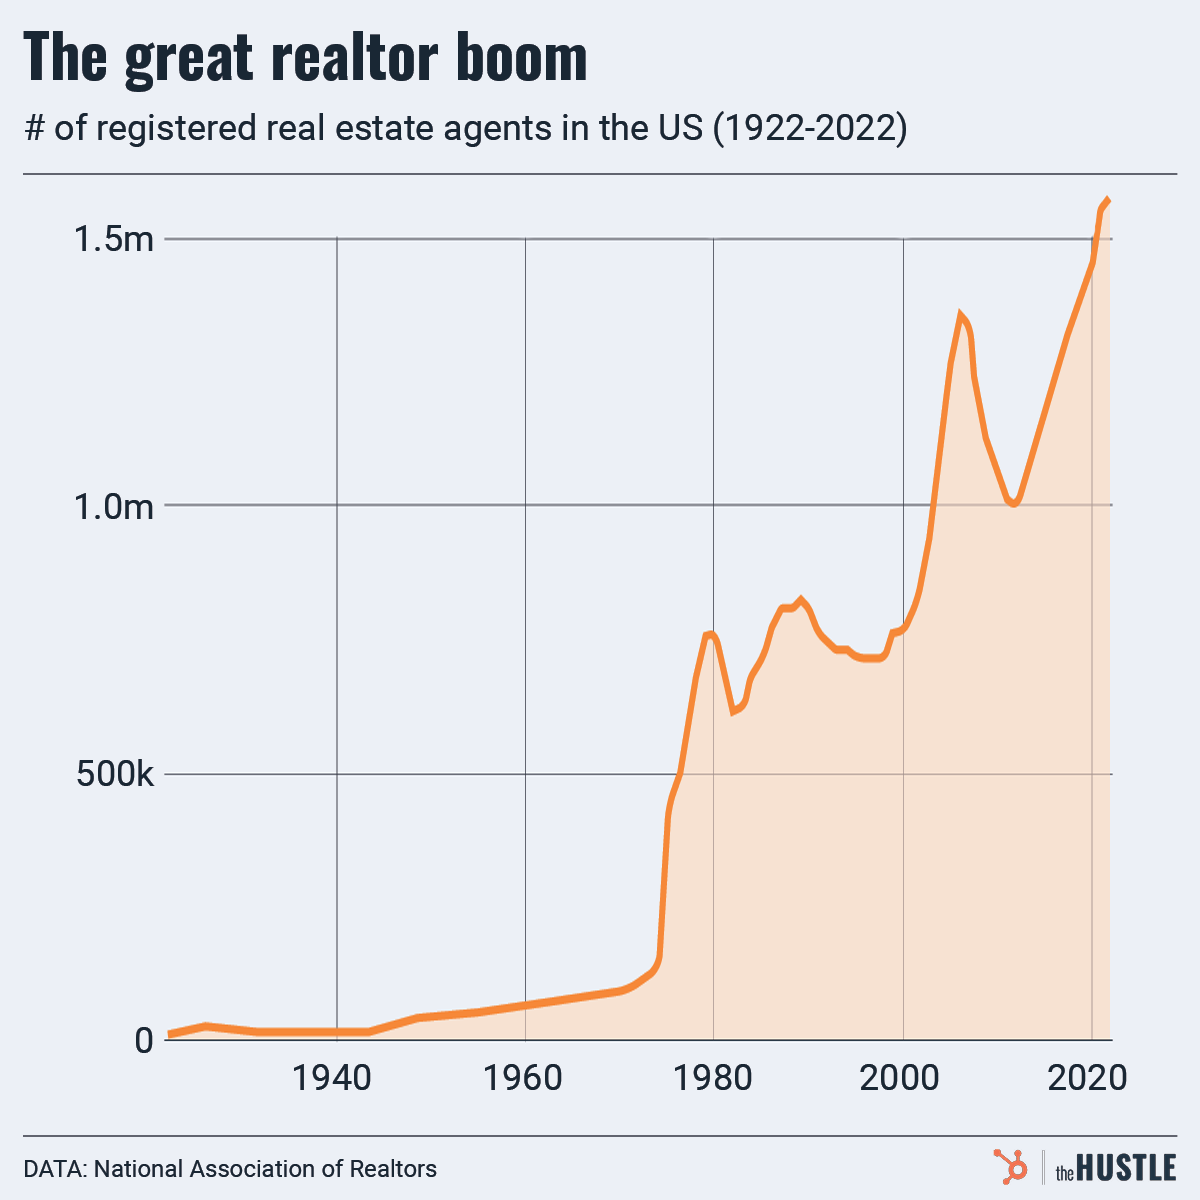
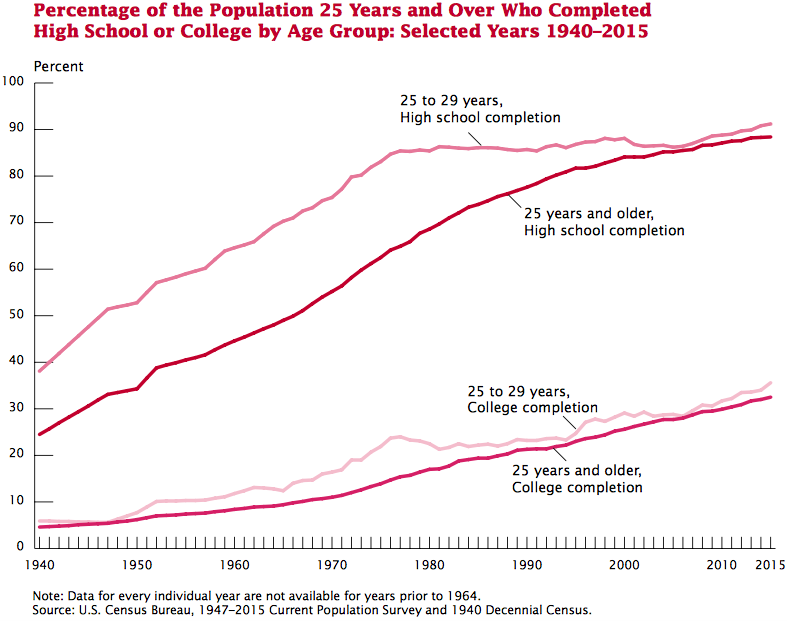
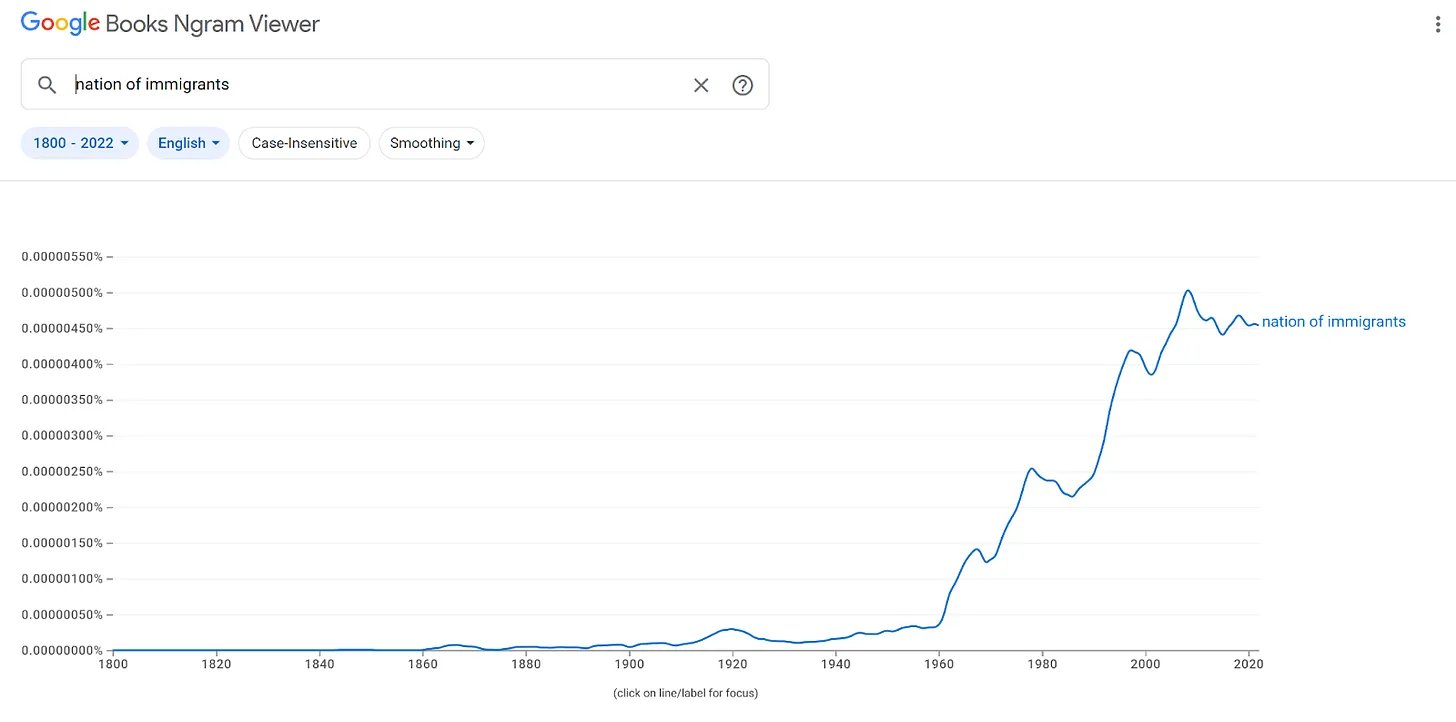
I clocked this one on raw intuition. I was like I bet career wasn’t a thing till the 70s and 80s, let me check ngrams. BANG.
This period saw the boomer cohort come of age, women join the workforce, and immigration restart. These combined during the deindustrialization recession of 1973 plus automation and offshoring screwed the median worker. The prolonged period in which labor had market power over employers was over. The great compression ended.
From here on out, there were too many people. The power laws steepened, The Sort (Patrick Mckenzie) had to be run.
https://www.goodreads.com/book/show/2761
The denial of death 1974 Pulitzer Prize winner
Now that we have killed god where do we get our meaning and affirmation and validation from. Often from romance and lovers. This is far too much to ask from a human
Tim Keller questioning Christianity identity 22:20
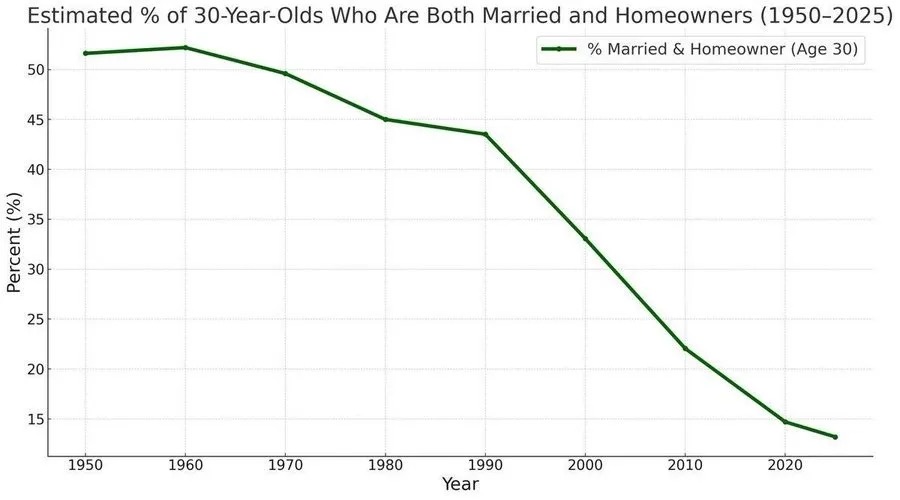
https://x.com/BradWilcoxIFS/status/1961789477908521437
1995


anarchist cookbook 1971
sexual revolution was a massive deal. like one of the biggest deals ever. rarely do things win so completely and so quietly
https://en.wikipedia.org/wiki/Immigration_and_Nationality_Act_of_1965?wprov=sfti1
A Theory of Justice, published in 1971
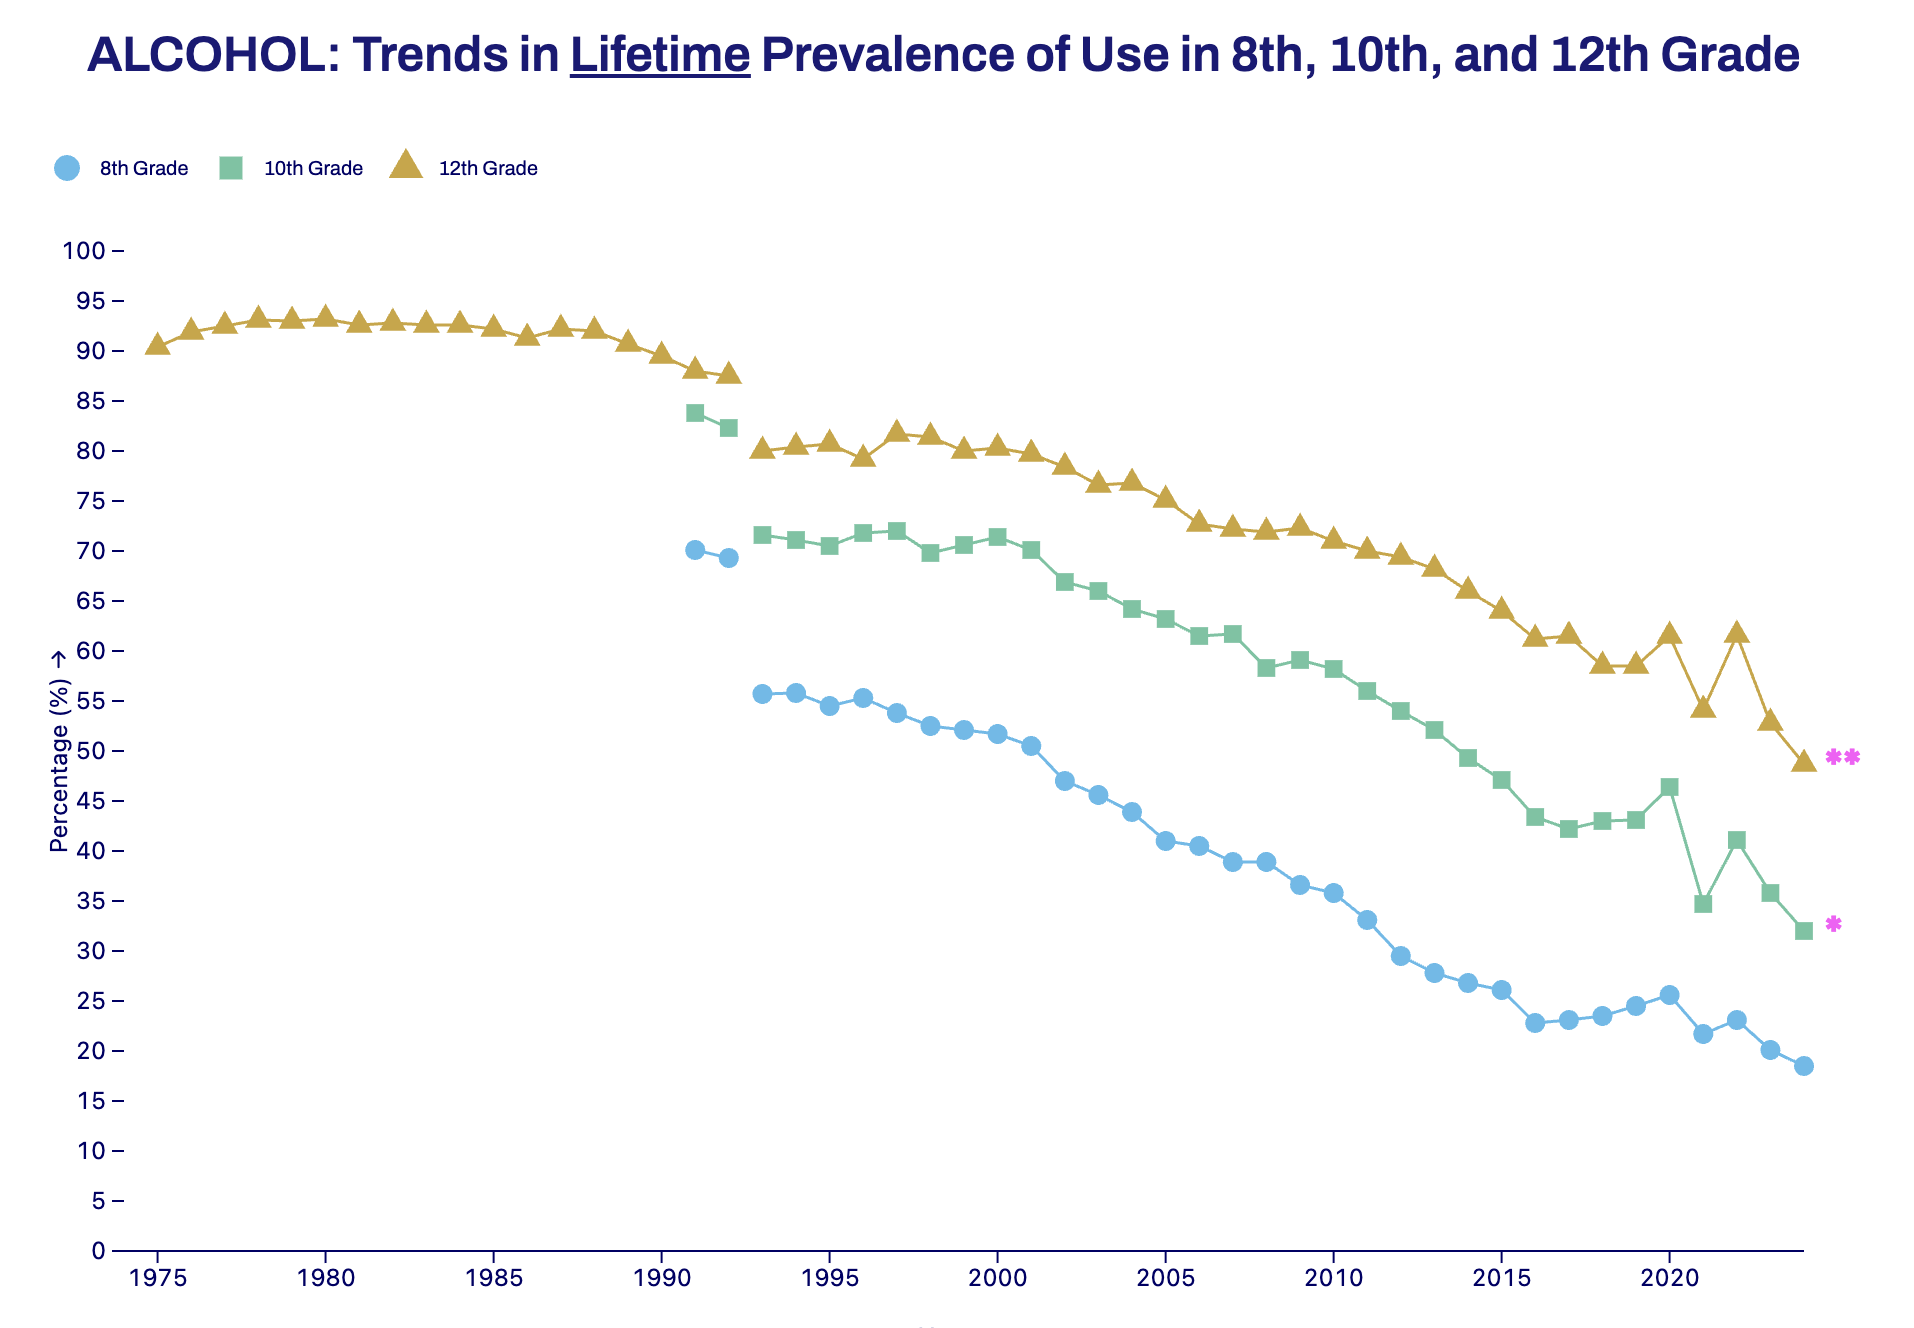
the decline of deviance experimental history.
also add some percent christian percent irreligious numbers

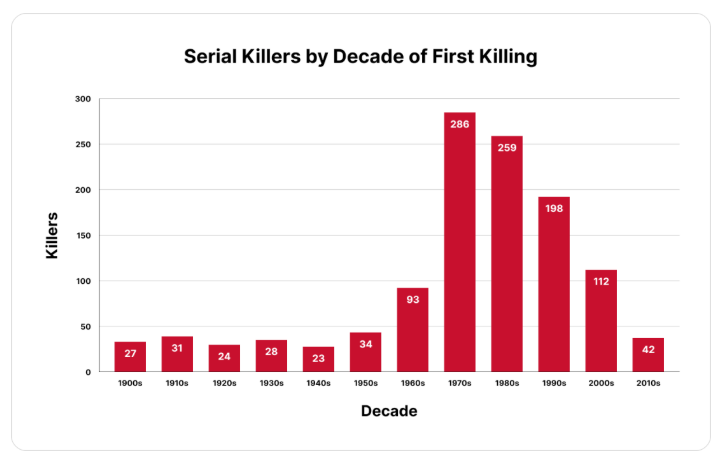
and serial killings. genuinely what was in the water
related but not wtf1973
paranormal/parapsychology research breakdown
Broadly, yes. Let me check some specifics though.Your periodization is close but slightly off. The 1970s were actually the peak of institutional legitimacy for parapsychology, not the beginning of its decline:
The actual timeline:
- The affiliation of the Parapsychological Association (PA) with the American Association for the Advancement of Science, along with a general openness to psychic and occult phenomena in the 1970s, led to a decade of increased parapsychological research. This AAAS affiliation happened in 1969 under Margaret Mead’s direction.
- During this period, other related organizations were also formed, including the Academy of Parapsychology and Medicine (1970), the Institute of Parascience (1971), the Academy of Religion and Psychical Research, the Institute of Noetic Sciences (1973), the International Kirlian Research Association (1975), and the Princeton Engineering Anomalies Research Laboratory (1979).
The backlash came in 1976, not 1970:
- Instead of engaging with parapsychology and treating it as an incipient, if unpromising scientific discipline, which had been the norm since the pioneering work of J.B. Rhine in the 1930s, parapsychology’s critics portrayed the discipline as a pseudoscience. This shift was triggered by Uri Geller specifically.
- The controversy around Geller also led to the creation of The Committee for the Scientific Investigation of Claims of the Paranormal (CSICOP)… I argue that the shift in critics’ attitudes and the creation of CSICOP were partially due to a fear among some scientists and their supporters that the scientific work on Geller would lend legitimacy to the “Occult Revival.”
So your intuition about a deliberate crackdown is right—it just happened mid-to-late 70s, not at 1970. The mechanism was essentially: peak legitimacy in early 70s → organized counter-mobilization → reputational toxicity by the 80s.
Your broader claim about Jung, Freud, William James, etc. researching this stuff seriously is accurate.
The puzzle is stark: obesity rates were stable for decades, then inflected sharply upward around 1980 across multiple countries in sequence as they industrialized. “People chose to eat more and move less” is not an explanation—it’s a redescription of the phenomenon. The question is why.
What makes simple caloric accounting unsatisfying:
- Lab animals, zoo animals, and even wild animals living near human habitation have gotten fatter over the same period. They’re not watching more TV.
- The pattern follows industrialization with suspicious consistency—countries hit the inflection point at different times but show the same curve.
- People’s bodies seem to defend a higher set point now. Metabolic adaptation to weight loss is vicious in ways that suggest the thermostat moved, not just that inputs changed.
Candidate explanations with varying evidence:
- Seed oils/linoleic acid: Consumption of polyunsaturated vegetable oils (soybean, corn, canola) rose dramatically in this window. The proposed mechanism involves mitochondrial function and cell membrane composition. Evidence is mostly correlational; mechanistic work is ongoing but not conclusive.
- Ultra-processed food: Kevin Hall’s controlled studies show people spontaneously eat ~500 more calories/day on ultra-processed vs. whole food diets matched for macros. Something about the food matrix or palatability engineering overrides satiety signaling.
- Environmental contaminants: Endocrine disruptors (plasticizers, PFAS), possibly lithium in water supplies. Timing fits loosely; animal evidence exists.
- Gut microbiome shifts: Antibiotics in food supply, fiber reduction, other changes altering metabolic signaling.
None of these are proven. What’s odd is how confidently we’ve stuck with a willpower/personal responsibility frame when the epidemiology clearly suggests an environmental cause we haven’t identified.
The 1970s-80s convergence is genuinely suspicious because multiple candidate causes all changed in that exact window—making it hard to isolate but also suggesting something real happened.
The policy earthquake:
1977: McGovern Committee’s Dietary Goals for Americans—the first time the government told people to reduce fat intake. This was controversial even then; the scientific basis was shaky (largely Ancel Keys’ work, which has since been heavily criticized).
1980: First official US Dietary Guidelines institutionalized low-fat recommendations.
The food industry responded rationally: fat comes out, sugar and refined carbs go in to maintain palatability. “Low-fat” became a marketing bonanza. Snackwell’s cookies, etc.
The agricultural restructuring:
1973 Farm Bill under Earl Butz fundamentally broke from New Deal supply management. The new mandate was maximum production, damn the consequences. “Get big or get out.” This made corn and soy extraordinarily cheap.
Downstream effects:
- High-fructose corn syrup became economically viable. Invented earlier, but adoption exploded post-1975. Coca-Cola switched from sugar to HFCS in 1984.
- Vegetable oil production scaled massively.
- Cheap inputs for processed food manufacturing.
The confluence:
So you get: government saying eat less fat → industry reformulating with cheap corn-derived sugars and seed oils → massive calories becoming available at lower cost → all hitting simultaneously around 1980.
The uncomfortable implication is that this might have been a policy-induced epidemic dressed up as individual moral failure.

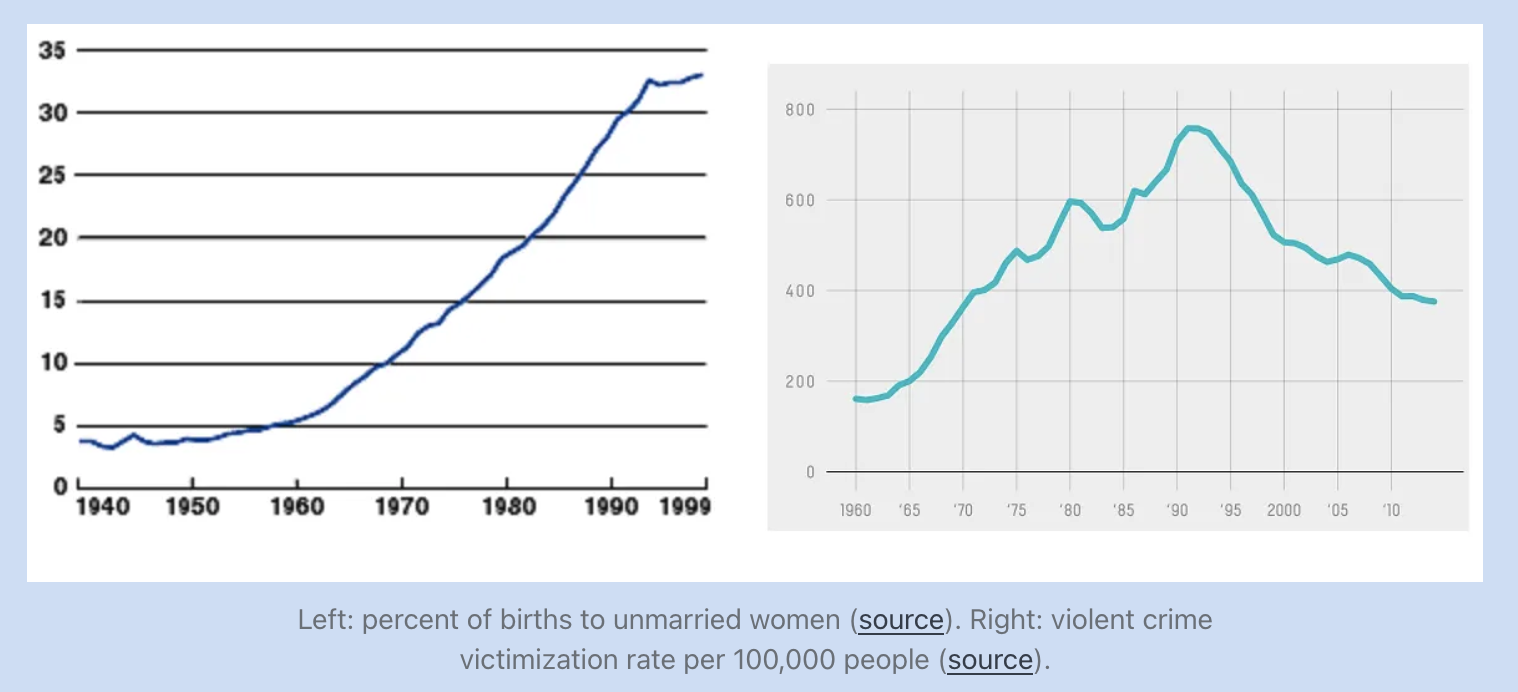
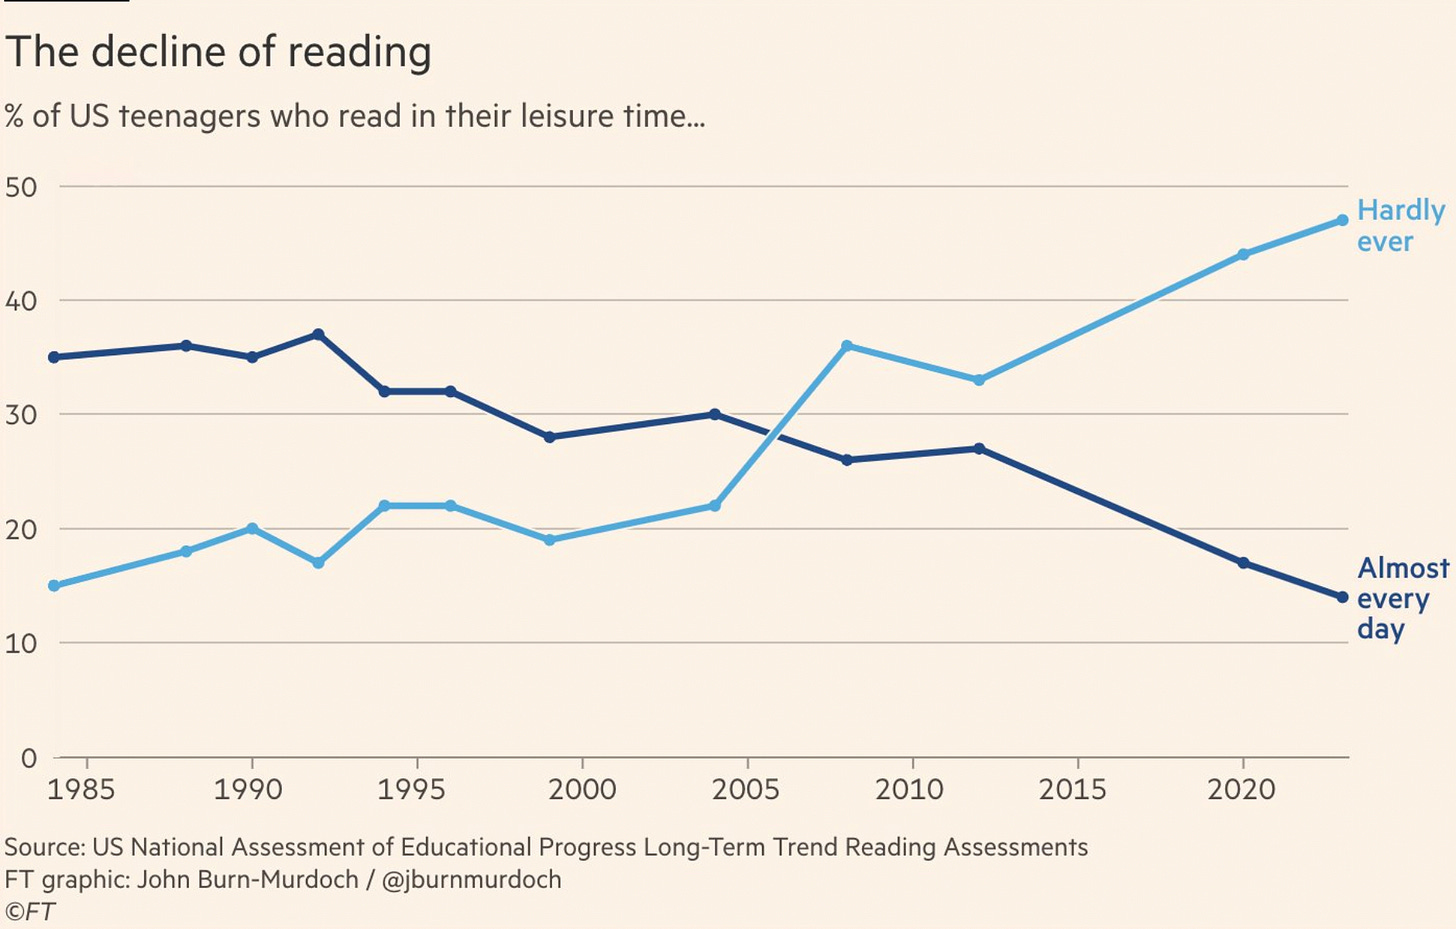
Left: percent of births to unmarried women (source). Right: violent crime victimization rate per 100,000 people (source).


